Pie charts Study guides, Revision notes & Summaries
Looking for the best study guides, study notes and summaries about Pie charts? On this page you'll find 626 study documents about Pie charts.
All 626 results
Sort by
 Popular
-
MIP2602 assignment 4 (DETAILED ANSWERS) 2023 (225269) -DUE 25 August 2023
- Exam (elaborations) • 20 pages • 2023
- £2.20
- 18x sold
- + learn more
MIP2602 assignment 4 (DETAILED ANSWERS) 2023 () -DUE 25 August 2023 100% TRUSTED workings, explanations and solutions. For assistance call or whatsapp us on +25477 954 0132 . Question 1 1.1 What type(s) of data are best for using the following? 1.1.1 A stem-and-leaf plot (2) 1.1.2 A bar chart (2) 1.1.3 Pie chart (2) 1.1.4 Scatter plot (2) 1.1.5 Line graph (2) 1.1.6 A histogram (1) 1.1.7 Box-and-whisker plot (1) 1.2 How is the bar graph better than the pictograph? (4) 1.3 Whe...
 Popular
-
CSTR EXAM 2024 100% COMPLETE ACTUAL QUESTIONS WITH VERIFIED ANSWERS GENUINE EXAM GRADED A+
- Exam (elaborations) • 17 pages • 2024 Popular
- £10.56
- 2x sold
- + learn more
CSTR EXAM 2024 100% COMPLETE ACTUAL QUESTIONS WITH VERIFIED ANSWERS GENUINE EXAM GRADED A+ Name the bones of the skull Parietal x 2, Frontal, Sphenoid, ethmoid, Occipital, temporal x 2 What injury would cause Racoon eyes? Basal skull fx, Frontal fx What are signs of a basal skull fx? Frontal - racoon eyes, Middle Fossa - CSF leak, Posterior - battle signs What are diffuse intracranial Injuries? Concussion, shear injury, DAI, Anoxic brain injury What are focal intracranial In...
-
WGU C955 Applied Probability and Statistics Final Exam (Latest 2023/ 2024 Update) Questions and Verified Answers| 100% Correct| Grade A
- Exam (elaborations) • 35 pages • 2023
- £8.94
- 2x sold
- + learn more
WGU C955 Applied Probability and Statistics Final Exam (Latest 2023/ 2024 Update) Questions and Verified Answers| 100% Correct| Grade A Q: In a statistics class, 40 students are asked to write their age on a piece of paper and place the paper in a box. After rotating and shaking the box, 5 pieces of paper are drawn from the box at random. The data results are as follows: 36 22 21 20 19 What is the median for this data set? A) 17 B) 21 C) 24 D) 28 Answer: 21 Q: A new video g...
-
NAHQ Practice CPHQ Questions And Answers 2022
- Exam (elaborations) • 33 pages • 2022
- £10.16
- 2x sold
- + learn more
1- In evaluating "long waiting times," a healthcare quality professional best demonstrates components related to staffing, methods, measures, materials, and equipment utilizing A. a run chart. B. a histogram. C. a pie chart. D. an Ishikawa diagram. - Answer - EXPLANATIONS: A. Run charts are used to track data over time. B. Histograms and bar charts are used to show distribution. C. Pie charts are used to compare parts of a whole. D. An Ishikawa (cause and effect) diagram helps to a...

-
IAAO Course 300 (2022/2023) Already Passed
- Exam (elaborations) • 14 pages • 2023
- £8.12
- 1x sold
- + learn more
IAAO Course 300 (2022/2023) Already Passed Mass appraisal Systematic appraisal of groups of properties as of a given date using standardized procedures and statistical testing. Purpose of mass appraisal Equitable and efficient appraisal of all property in a jurisdiction for ad valorem tax purposes. When did first generation computers emerge? The 1950s Mass appraisal models may be: Physical, conceptual or mathematical. Property valuation models seek to explain or predict what? The market valu...


-
Refining_your_Graphs_VisualAnalytics_Week14_NEC_Solved
- Exam (elaborations) • 6 pages • 2023
- £8.53
- 1x sold
- + learn more
1. look at the first six rows of the asasec dataset 2. plot members v revenue for 2014 in a scatterplot with a confidence interval 3. switch from loess to ols and add the Journal variable 4. show the first six rows of studebt 5. create a faceted comparison of the two distributions - percent of all borrowers and Percent of all balances to show how student loan debt is distributed. 6. Compare this pair of graphs to the pie charts in figure 8.24 Which visualization do you find it easier to ma...

-
Supply chain and management International Business year 2
- Summary • 25 pages • 2023
- £6.99
- 1x sold
- + learn more
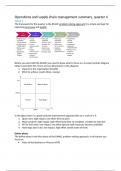
In this document the different phases within supply chain management are discussed. Also different models are discussed: audit cycle, KPI tree, impact effort matrix, weighted decision matrix, 5 whys analysis, fishbone diagram, Yamazumi dashboard, Spaghetti diagram, layout warehouse, layout store, layout factory, time series plots, histogram, bar and pie charts, scatter plots, Pareto chart, define project charter, DMAIC
-
MSIS 3223 Exam 1 Questions and Answers (Graded A)
- Exam (elaborations) • 4 pages • 2022
- £6.42
- 2x sold
- + learn more
MSIS 3223 Exam 1 Questions and Answers (Graded A) Which of the following ways would 10 raised to the power of 2 x 5 raised to the power of 3/100 - 73 be represented in an excel spreadsheet? - ANSWER-10^2^5^3 / 100 - 73 Which of the following is a difference between relative addressing and absolute addressing when using cell formulas in excel? - ANSWER-A relative address uses just the row and column label in the cell reference; an absolute address uses a dollar sign before either the row or...
-
WGU - D265 - Critical Thinking - Reason and Evidence Latest Update (2022/2023) Already Passed
- Exam (elaborations) • 20 pages • 2023
- £8.12
- 2x sold
- + learn more
WGU - D265 - Critical Thinking - Reason and Evidence Latest Update (2022/2023) Already Passed PROPOSITIONS Are statements that can be true or false NON-PROPOSITONS Are sentences that are not statements about matters of fact or fiction. They do not make a claim that can be true or false. SIMPLE PROPOSITIONS Have no internal logic structure, meaning whether they are true or false does not depend on whether a part of them is true or false. They are simply true or false on their own. (Example: Har...
-
NAHQ Practice CPHQ Questions with correct answers
- Exam (elaborations) • 57 pages • 2023
- £12.19
- + learn more
1- In evaluating "long waiting times," a healthcare quality professional best demonstrates components related to staffing, methods, measures, materials, and equipment utilizing A. a run chart. B. a histogram. C. a pie chart. D. an Ishikawa diagram. Correct Answer-EXPLANATIONS: A. Run charts are used to track data over time. B. Histograms and bar charts are used to show distribution. C. Pie charts are used to compare parts of a whole. D. An Ishikawa (cause and effect) diagram helps ...
