Pie charts Study guides, Revision notes & Summaries
Looking for the best study guides, study notes and summaries about Pie charts? On this page you'll find 655 study documents about Pie charts.
Page 3 out of 655 results
Sort by

-
MISY 5325 Excel Midterm Ultimate Review Questions And Answers With Verified Solutions
- Exam (elaborations) • 123 pages • 2024
- Available in package deal
-
- £6.43
- + learn more
(Excel) TRUE/FALSE: To add a pie chart, first select the data to be charted and then tap or click the Insert Pie or Doughnut Chart button (INSERT tab | Charts group). - TRUE (Excel) TRUE/FALSE: To use the AutoCalculate area, select the range of cells containing the numbers for a calculation you want to verify and then press and hold or double-click the AutoCalculate area to display the Customize Status Bar shortcut menu. - FALSE (Excel) TRUE/FALSE: The Microsoft Office Specialist (MOS) p...
-
NAHQ Practice CPHQ Questions & Answers 2024
- Exam (elaborations) • 52 pages • 2023
- Available in package deal
-
- £11.27
- + learn more
NAHQ Practice CPHQ Questions & Answers 2024 2011 MOQ 1- In evaluating "long waiting times," a healthcare quality professional best demonstrates components related to staffing, methods, measures, materials, and equipment utilizing A. a run chart. B. a histogram. C. a pie chart. D. an Ishikawa diagram. - ANS-EXPLANATIONS: A. Run charts are used to track data over time. B. Histograms and bar charts are used to show distribution. C. Pie charts are used to compare parts of a whole. ...
-
Test Bank for Statistics for People Who (Think They) Hate Statistics, 7th Edition by Neil J. Salkind
- Exam (elaborations) • 348 pages • 2022
-
- £31.80
- 1x sold
- + learn more
Test Bank for Statistics for People Who (Think They) Hate Statistics 7e 7th Edition by Neil J. Salkind, Bruce B. Frey ISBN-13: 1855 Full Chapters test bank includes Multiple Choice questions answers (MCQS) and Short QA,s Chapter 1 • Statistics or Sadistics? It’s Up to You • What You Will Learn in This Chapter Why Statistics? And Why SPSS? A 5-Minute History of Statistics Statistics: What It Is (and Isn’t) What Are Descriptive Statistics? What Are Inferential Statistics? ...
-
Splunk Core Certified Power User Questions and Answers 100% Pass
- Exam (elaborations) • 23 pages • 2024
- Available in package deal
-
- £10.53
- + learn more
What is the only writeable bucket type? The hot bucket By what filter are indexes divided into buckets? By time What are the 4 types of searches in Splunk (by performance) Dense, Sparse, Super Sparse, Rare In searches, what is the scanCount? The number of events scanned for that particular search What are the requirement of the underlying search in order to get multi-series table? The underlying search must use reporting search commands like chart or timechart What are the seven chart typ...

-
CSTR EXAM LATEST 2023-2024 REAL EXAM 180 QUESTIONS AND CORRECT ANSWERS (VERIFIED ANSWERS)|AGRADE LATEST UPDATES.
- Exam (elaborations) • 23 pages • 2023
-
- £8.93
- + learn more
What are types of graphic presentation? - ANSWER- Bar graphs, pie charts, line graphs, control charts, dashboards, spreadsheets, scatter grams, pareto chart, radar chart, tree chart What does a bar graph show? - ANSWER- Horizontal or vertical bars proportional to the values of the data. These are used for quick comparison of information. What does a pie chart show? - ANSWER- Show proportions of a whole or percentage of a whole. What does a line graph show? - ANSWER- Line connecting d...
-
Tableau Desktop Specialist Certification Test | All Questions & Answers (100% Correct)
- Exam (elaborations) • 14 pages • 2023
- Available in package deal
-
- £9.66
- + learn more
Tableau Desktop Specialist Certification Test | All Questions & Answers (100% Correct) Tableau Desktop Specialist Certification Test | All Questions & Answers (100% Correct) How many rows of data appear in Tableau preview? - ANSWER - 1000 What is the data source page? - ANSWER - This is where you connect to a data source and see sheets from the data source (on left , shown) to bring into the join area. Drag or double click sheets to bring onto the canvas. What is a mark? - ANSWER - The...
-
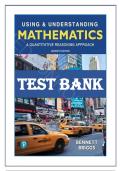
TEST BANK for Using & Understanding Mathematics: A Quantitative Reasoning Approach 7th Edition by Jeffrey Bennett and William Briggs. All 12 Chapters. (complete Download). 431 Pages.
- Exam (elaborations) • 431 pages • 2024
-
- £20.13
- + learn more
I. LOGIC AND PROBLEM SOLVING 1. Thinking Critically Activity: Bursting Bubble 1A. Living in the Media Age In Your World: Fact Checking on the Web 1B. Propositions and Truth Values 1C. Sets and Venn Diagrams Brief Review: Sets of Numbers 1D. Analyzing Arguments Mathematical Insight: Deductive Proof of the Pythagorean Theorem 1E. Critical Thinking in Everyday Life In Your World: Beware of “Up to” Deals 2. Approaches to Problem Solving Activity: Global Melting 2A. Understand, Solve, and Explain...
-
C468_video notes / WGU C468 INFORMATION MANAGEMENT AND APPLICATION OF TECHNOLOGY
- Lecture notes • 30 pages • 2023
-
- £10.06
- + learn more
MU, ARRA, HITECH, EBP, PICOT, goal of MU, Healthcare Informatics, IN role, INS role, IN Innovator role, Clinical information system charting # of AIS, what info is saved in EHR, CDSS alerts and reminders related to support clinical decision, value reimbursement, stages of MU (immunization, lab, notes, drug info-in which stage they were introduced), SNOMED, alert fatigue, HL7, SDLC (design(iterative code, usability testing script), plan(swot/scope and charter doc), implement (committee, time...
-
HRMT411 Final Exam Questions ad Answers Latest Update 2024/2025 (Graded A+)
- Exam (elaborations) • 32 pages • 2024
-
- £12.07
- + learn more
HRMT411 Final Exam Questions ad Answers Latest Update 2024/2025 (Graded A+) Which law incorporated arbitration into the union-employer environment? A. Norris-Laguardia B. Fair Labor Standards Act C. none of these choices D. Wagner Act E. Lily Ledbetter Act Answer Key:C Question 2 of 40 0.5/ 0.5 Points In early times, arbitration was referred to as: HRMT411 Final Exam Questions ad Answers Latest Update 2024/2025 Graded A+ A. community trial B. infor...

-
WGU C784 Statistics Module 4 (Latest 2023 / 2024) Actual Questions and Correct Answers
- Exam (elaborations) • 7 pages • 2023
- Available in package deal
-
- £9.66
- + learn more
1. Define Mode Answer: The value that occurs most often in a data set 2. The Mean of a data set represents the? Answer: Average 3. Median of a data set Answer: The middle value of the data set 4. What are the two types of variables Answer: 1) Quantitative Variable 2) Categorical Variable 5. Quantitative variable Answer: Quantitative variable - a variable that takes a numerical value that can be counted or measured. Examples: height, weight, age, cholesterol level, exam s...

How much did you already spend on Stuvia? Imagine there are plenty more of you out there paying for study notes, but this time YOU are the seller. Ka-ching! Discover all about earning on Stuvia


