Learning objectives
2. Dietary assessment:
Classify individuals according to their nutrient intake
FIL (food intake level) = EI (energy intake) / BMR (basal metabolic rate)
If people are in weight balance then the FIL should be similar to PAL(physical activity level)
(= EE/BMR). PAL is minimum 1.35 for sedentary lifestyle and 1.55 for an average PAL.
About the FIL:
- determines bias on group level
- limited on individual level
- need of age- and gender specific levels
- only for determining energy underreporting
Goldberg cut-off levels (PAL):
- 1.35 is PAL for sedentary lifestyle
- 1.55 is PAL for moderately active lifestyle
- 1.75 is PAL for active lifestyle
Example: reported average EI = 2100 kcal, and average BMR = 1500.
FIL = 2100/1500 = 1.40
- Compared to PAL 1.35 there is no underreporting;
- Compared to PAL 1.55 there is an average underreporting of 10%;
- Compared to PAL 1.75 there is an average underreporting of 20%
of intake.
Comparing with dietary reference values (DRI):
- EAR=estimated average requirement=meets requirement of 50% of population
- RDA=recommended daily allowance=meets requirement of 97.5% of population
- AI=adequate intake=thought to meet requirement of everyone
- UL=upper limit=highest intake without adverse effects
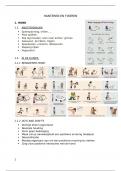
When you see this kind of table;
You should be able to tell;
, - For a population we take the EAR (estimated average requirement, which is sufficient
for 50% of the population): 200 mcg. RDA is too high for most of the population.
- You see that <25% of men have less than 219 mcg, but more than 5% have more
than 157 mcg. So, between 5-25% have adequate intake.
- You see that >25% of women have more than 174 mcg, but <50% have less than
216 mcg. So, between 25-50% have adequate intake.
When you get asked about an individual: woman with an intake of 220 mcg. You should be
able to tell;
- Her intake is higher than the EAR which is sufficient for 50% of the population, but
lower than the RDA which is sufficient for 97.5% of the population.
- We don't know her individual requirements; ill, malabsorption...
- So; if she has no increased requirement then her intake seems to be sufficient.
Choose the most optimal assessment method for various diet studies
Choosing a method in 6 steps:
1. What is the aim of the assessment?
2. What type of information do you need?
1. Aim 2. Type of info Assessment used
Mean intake of population Group mean One day record/recall
% <cut-off Group mean and distribution Repeated record/recall
Association intake-health Ranking or classification FFQ/diet history
Intake individual Absolute intake Multiple records/recalls
3. What is the target group?
Older people might not be able to do web-based or recall. Young people may not tell
everything with parents around.
4. What is the reference period?
Current intake: record/recall. Usual intake: FFQ/history
5. Does the data have to be comparable with other studies or populations?
If jes: same open method has to be used, because of cultural differences. An FFQ is
closed and population specific, so maybe not comparable with other countries.
6. How much time/finances/experience are available?
Explain what types of error are to be expected for commonly used dietary assessment
methods
Exercise info:
- Random errors average out by repeating the measurement or increasing the number
of participants.
- Systematic errors lead to over- or underreporting
Both errors can be present on the individual or group level. Systematic error on the individual
level may be random at the group level.
Sources of error in food consumption studies:
- Response error: under-or overestimation,
, - Coding error
- Portion size error
- Errors in food composition table
Errors in dietary assessment methods:
Assessment method Error Reason
FFQ All 4, but coding error is less FFQ is precoded, checked a
common lot, standardized coding.
Interview-based 24-hour All 4
recall
Web-based 24-hour recall All, but coding error is less Precoded
common
Estimated food record All 4
Weighed food record Only portion size error is not Because portions are
possible weighted
Dietary history All 4
Duplicate portion Only response error can
occur, but not common
Observer method All 4, but portion size and
food composition table
errors are less common
Non- quantitative FFQ: do not specify portion sizes.
Semi-quantitative FFQ: provide a combination of individual or typical/standard portion sizes
to estimate food quantities.
Quantitative FFQ: allows the respondent to indicate any amount of food typically consumed.
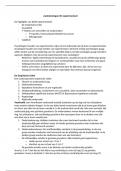
Random error will weaken the association (goes more to 1). This means that the actual
association is stronger and a RR below 1 will be smaller and above 1 will be larger (because
1 is no association, below 1 is protective association, so when it gets smaller below 1 there
is bigger protective association).
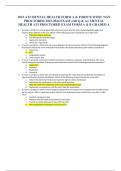
Comparison of intake with EAR:
- If random error: the distribution will be wider than the true distribution. Consequence:
prevalence at risk will be overestimated.
- If systematic error: the distribution will shift to the right (with over reporting!) and the
risk will be underestimated, or shift to the left (with under reporting!) and the risk will
be overestimated.
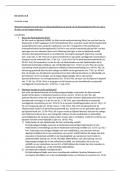
Calculated number of days needed:
n = (Za*CVw / D0)^2
Za: fixed number 1.96
CVw: SD/mean*100%
D0: % in which you want it to be accurate
->
2. Dietary assessment:
Classify individuals according to their nutrient intake
FIL (food intake level) = EI (energy intake) / BMR (basal metabolic rate)
If people are in weight balance then the FIL should be similar to PAL(physical activity level)
(= EE/BMR). PAL is minimum 1.35 for sedentary lifestyle and 1.55 for an average PAL.
About the FIL:
- determines bias on group level
- limited on individual level
- need of age- and gender specific levels
- only for determining energy underreporting
Goldberg cut-off levels (PAL):
- 1.35 is PAL for sedentary lifestyle
- 1.55 is PAL for moderately active lifestyle
- 1.75 is PAL for active lifestyle
Example: reported average EI = 2100 kcal, and average BMR = 1500.
FIL = 2100/1500 = 1.40
- Compared to PAL 1.35 there is no underreporting;
- Compared to PAL 1.55 there is an average underreporting of 10%;
- Compared to PAL 1.75 there is an average underreporting of 20%
of intake.
Comparing with dietary reference values (DRI):
- EAR=estimated average requirement=meets requirement of 50% of population
- RDA=recommended daily allowance=meets requirement of 97.5% of population
- AI=adequate intake=thought to meet requirement of everyone
- UL=upper limit=highest intake without adverse effects
When you see this kind of table;
You should be able to tell;
, - For a population we take the EAR (estimated average requirement, which is sufficient
for 50% of the population): 200 mcg. RDA is too high for most of the population.
- You see that <25% of men have less than 219 mcg, but more than 5% have more
than 157 mcg. So, between 5-25% have adequate intake.
- You see that >25% of women have more than 174 mcg, but <50% have less than
216 mcg. So, between 25-50% have adequate intake.
When you get asked about an individual: woman with an intake of 220 mcg. You should be
able to tell;
- Her intake is higher than the EAR which is sufficient for 50% of the population, but
lower than the RDA which is sufficient for 97.5% of the population.
- We don't know her individual requirements; ill, malabsorption...
- So; if she has no increased requirement then her intake seems to be sufficient.
Choose the most optimal assessment method for various diet studies
Choosing a method in 6 steps:
1. What is the aim of the assessment?
2. What type of information do you need?
1. Aim 2. Type of info Assessment used
Mean intake of population Group mean One day record/recall
% <cut-off Group mean and distribution Repeated record/recall
Association intake-health Ranking or classification FFQ/diet history
Intake individual Absolute intake Multiple records/recalls
3. What is the target group?
Older people might not be able to do web-based or recall. Young people may not tell
everything with parents around.
4. What is the reference period?
Current intake: record/recall. Usual intake: FFQ/history
5. Does the data have to be comparable with other studies or populations?
If jes: same open method has to be used, because of cultural differences. An FFQ is
closed and population specific, so maybe not comparable with other countries.
6. How much time/finances/experience are available?
Explain what types of error are to be expected for commonly used dietary assessment
methods
Exercise info:
- Random errors average out by repeating the measurement or increasing the number
of participants.
- Systematic errors lead to over- or underreporting
Both errors can be present on the individual or group level. Systematic error on the individual
level may be random at the group level.
Sources of error in food consumption studies:
- Response error: under-or overestimation,
, - Coding error
- Portion size error
- Errors in food composition table
Errors in dietary assessment methods:
Assessment method Error Reason
FFQ All 4, but coding error is less FFQ is precoded, checked a
common lot, standardized coding.
Interview-based 24-hour All 4
recall
Web-based 24-hour recall All, but coding error is less Precoded
common
Estimated food record All 4
Weighed food record Only portion size error is not Because portions are
possible weighted
Dietary history All 4
Duplicate portion Only response error can
occur, but not common
Observer method All 4, but portion size and
food composition table
errors are less common
Non- quantitative FFQ: do not specify portion sizes.
Semi-quantitative FFQ: provide a combination of individual or typical/standard portion sizes
to estimate food quantities.
Quantitative FFQ: allows the respondent to indicate any amount of food typically consumed.
Random error will weaken the association (goes more to 1). This means that the actual
association is stronger and a RR below 1 will be smaller and above 1 will be larger (because
1 is no association, below 1 is protective association, so when it gets smaller below 1 there
is bigger protective association).
Comparison of intake with EAR:
- If random error: the distribution will be wider than the true distribution. Consequence:
prevalence at risk will be overestimated.
- If systematic error: the distribution will shift to the right (with over reporting!) and the
risk will be underestimated, or shift to the left (with under reporting!) and the risk will
be overestimated.
Calculated number of days needed:
n = (Za*CVw / D0)^2
Za: fixed number 1.96
CVw: SD/mean*100%
D0: % in which you want it to be accurate
->