Visualising data Study guides, Revision notes & Summaries
Looking for the best study guides, study notes and summaries about Visualising data? On this page you'll find 7 study documents about Visualising data.
All 7 results
Sort by
 Popular
-
AP CSP Data Unit, questions and answers, 100% Accurate. Graded A+
- Exam (elaborations) • 4 pages • 2023
- £6.60
- 1x sold
- + learn more
AP CSP Data Unit, questions and answers, 100% Accurate. Graded A+ Metadata - -data about data Can be descriptive data about an image, a Web page, or other objects Can increase the effective use of data or data sets by providing additional info about various aspects of that data Software tools (spreadsheets & databases) - -help to efficiently organize & find trends in info Info filtering systems - -are important tools for finding info & recognizing patterns Fusion Tables - -we...
-
Software Engineering
- Exam (elaborations) • 37 pages • 2023
- £11.14
- + learn more
1. Software Engi- neering Multi-person construction of multi-person software. 2. System Purposeful collection of interrelated components working together to achieve a common goal. 3. Requirements Engineering The process of eliciting: The services that the customer requires from a system. The constraints under which it operates and is developed. 4. Requirements Descriptions of the system services and constraints that are generated during the requirement engineering process. ...

-
Visual Analysis
- Lecture notes • 25 pages • 2024
- £4.19
- + learn more
Theorising ‘the visual’ in social research Visual Approaches in Sociology Semiotics (language of signs) Reading visual images (with examples)
-
IB149_Week 2_Visualising Data
- Summary • 7 pages • 2023
- £3.98
- + learn more
Notes summarising all the content from lectures and includes worked examples to better understand concepts
-
Web Development
- Exam (elaborations) • 16 pages • 2023
- £21.46
- + learn more
Discuss the relevance of D3;Correct Answer-With big data there is more data than can be presented reasonably using tables D3 provides a range of techniques for visualising data. It facilitates interaction, meaning users can tailor a visualisation for their own needs. It is well suited to use in a browser given its reliance on SVG Explain CSS syntax;Correct Answer- Explain how you would use a CSS counter;Correct Answer- Explain the CSS box model;Correct Answer- Explain the CSS disp...

Fear of missing out? Then don’t!

-
DECO2500 Exam2013-human-computer-interaction Set 1 & 2
- Exam (elaborations) • 11 pages • 2019
- £4.95
- + learn more
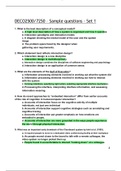
DECO2500/7250 – Sample questions - Set 1 1. What is the best description of a conceptual model? a. A high level description of how a system is organised and how it operates b. Interaction paradigms and interaction modes c. A diagram showing the mental model of the user and the system image d. The problem space faced by the designer when gathering user requirements. 2. Which statement best reflects interaction design? a. Interaction design is a new discipline b. Interaction design is multidisci...

-
Chapter 5 Presentation of data statistics
- Interview • 6 pages • 2023
- £81.74
- + learn more
This PDF is About Data presentation is a process of comparing two or more data sets with visual aids, such as graphs. Using a graph, you can represent how the information relates to other data. This process follows data analysis and helps organise information by visualising and putting it into a more readable format.
