Contingency tables Study guides, Revision notes & Summaries
Looking for the best study guides, study notes and summaries about Contingency tables? On this page you'll find 445 study documents about Contingency tables.
Page 3 out of 445 results
Sort by

-
Test Bank For Business Analytics Data Analysis & Decision Making, 6th Edition by S. Christian Albright
- Exam (elaborations) • 567 pages • 2023
-
- £24.49
- + learn more
Ch3 1. To examine relationships between two categorical variables, we can use: a. b. c. d. ANSWER: POINTS: DIFFICULTY: TOPICS: OTHER: counts and corresponding charts of the counts scatter plots histograms none of these choices a 1 Easy | Bloom's: Knowledge A-Head: 3-2 Relationships Among Categorical Variables BUSPROG: Analytic | DISC: Descriptive Statistics 2. Tables used to display counts of a categorical variable are called: a. crosstabs b. contingency tables c. either crosstabs ...

-
Test Bank For Business Analytics Data Analysis & Decision Making 6th Edition By S. Christian Albright
- Exam (elaborations) • 567 pages • 2023
-
- £24.49
- + learn more
Ch3 1. To examine relationships between two categorical variables, we can use: a. b. c. d. ANSWER: POINTS: DIFFICULTY: TOPICS: OTHER: counts and corresponding charts of the counts scatter plots histograms none of these choices a 1 Easy | Bloom's: Knowledge A-Head: 3-2 Relationships Among Categorical Variables BUSPROG: Analytic | DISC: Descriptive Statistics 2. Tables used to display counts of a categorical variable are called: a. crosstabs b. contingency tables c. either crosstabs ...

-
Test Bank For Business Analytics Data Analysis and Decision Making 6th Edition Albright
- Exam (elaborations) • 558 pages • 2023
-
- £24.49
- + learn more
1. To examine relationships between two categorical variables, we can use: a. counts and corresponding charts of the counts b. scatter plots c. histograms d. none of these choices ANSWER: a POINTS: 1 DIFFICULTY: Easy | Bloom's: Knowledge TOPICS: A-Head: 3-2 Relationships Among Categorical Variables OTHER: BUSPROG: Analytic | DISC: Descriptive Statistics 2. Tables used to display counts of a categorical variable are called: a. crosstabs b. contingency tab...

-
Test Bank For Data Analysis Optimization and Simulation Modeling International Edition 4th Edition by S. Christian Albright
- Exam (elaborations) • 539 pages • 2023
-
- £24.49
- + learn more
CHAPTER 3: Finding Relationships Among Variables MULTIPLE CHOICE 1. 2. 3. 4. To examine relationships between two categorical variables, we can use a. Counts and corresponding charts of the counts b. Scatterplots c. Histograms d. None of these options ANS: A PTS: 1 MSC: AACSB: Analytic Tables used to display counts of a categorical variable are called 5. 6. ANS: E PTS: 1 The most common data format is a. Long b. Short MSC: AACSB: Analytic c. Stacked d. Unstacked MSC: AACSB: ...
-
C743 Data Mining 1 - Terminology exam 2023 with 100% complete solutions
- Exam (elaborations) • 33 pages • 2023
- Available in package deal
-
- £13.68
- + learn more
Cramer V Test - Used to indicate how strongly associated two different categorical/nominal variables are with each other. - Based on Pearson Chi-Square statistic - Test is performed on contingency tables - Cramer's V value is between 0 & 1. - Values closer to 0 indicate little association between variables. - Values closer to 1 indicated strong association between variables. - In 2x2 contingency table, Cramer's V = Phi coefficient - Can be used on tables with size > 2x2 (i.e. 3x3, 3...
-
Marketing Analytics MIDTERM, Questions and Answers _ 100% out of 100% A+
- Exam (elaborations) • 16 pages • 2023
-
- £7.80
- + learn more
Marketing Analytics MIDTERM, Questions and Answers _ 100% out of 100% A+ What are the 5 Opportunities for Marketing Analytics (i.e. the Marketing Analytics Process)? - CORRECT ANSWER-1. Improve company performance (e.g. profits) 2. Identify opportunities 3. Build analytic foundation 4. Reasoned decision making 5. Guide implementation A marketing model is a ________ model designed to assist marketing managers in strategic decision making. - CORRECT ANSWER-PREDICTIVE model A marketi...

-
HIM 3200|92 Questions with 100% Correct Answers | Verified | Latest Update
- Exam (elaborations) • 12 pages • 2024
- Available in package deal
-
- £6.43
- + learn more
True or False? The more spread out the points on a scatter plot are, with respect to the straight line of best fit through them, the stronger the association between the variables. - ️️False True or False? The infant mortality rate is defined as the number of infant deaths among infants age 0 to 1 year divided by the number of live births during the same year. - ️️True True or False? Loss of study participants in longitudinal studies can make estimating the cumulative incidence of ...
-
QMB 3200 Bliss Final (with Mindtap Flashcards Questions & Answers 100% Accurate!!
- Exam (elaborations) • 10 pages • 2024
-
- £9.66
- + learn more
Treatments - ANSWERSDifferent Levels of a factor Response Variable - ANSWERSAnother word for the dependent variable of interest. Factor - ANSWERSAnother word for the independent variable of interest. Anova Table - ANSWERSA table used to summarize the analysis of variance computations and results. It contains columns showing the source of variation, the sum of squares, the degrees of freedom, the mean square, the F value(s), and the p-value(s). Analysis of Variance (ANOVA) - ANSWERSca...
-
☆Super Extensive Summary of Research Training II ☆ Combined transcription of all the online lectures and pdf pages!
- Summary • 141 pages • 2022
-
- £7.83
- 9x sold
- + learn more
This document contains a combination of the transcription of all the online lectures (excluding the tutorials!) and the pdf pages of Research Training II of the Premaster IBA at RSM. I made this because I find it easier to read than to listen to. I figured this would be very useful for other students too. Especially during the exam as you can CTRL + F through the document. I worked very long and hard on this so please don't share this with others. Thank you for ...
-
BST 322 Week 3 Test Questions with Correct Answers
- Exam (elaborations) • 2 pages • 2024
- Available in package deal
-
- £10.86
- + learn more
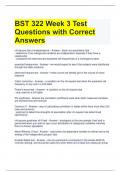
BST 322 Week 3 Test Questions with Correct Answers chi-square test of independence - Answer-- basic non-parametric test - determine if two categorical variables are independent; basically if they have a relationship - compares the observed and expected cell frequencies of a contingency table expected frequencies - Answer-- we would expect to see if the subjects were distributed through the table randomly observed frequencies - Answer-- those counts we literally got in the course of so...

Do you wonder why so many students wear nice clothes, have money to spare and enjoy tons of free time? Well, they sell on Stuvia! Imagine your study notes being downloaded a dozen times for £15 each. Every. Single. Day. Discover all about earning on Stuvia


