Histograms Study guides, Revision notes & Summaries
Looking for the best study guides, study notes and summaries about Histograms? On this page you'll find 747 study documents about Histograms.
Page 4 out of 747 results
Sort by
-
WGU PRE-ASSESSMENT: OPERATIONS AND SUPPLY CHAIN MANAGEMENT (PHCO) 2023 QUESTIONS AND ANSWERS 100% VERIFIED
- Exam (elaborations) • 28 pages • 2024
- £15.85
- + learn more
WGU PRE-ASSESSMENT: OPERATIONS AND SUPPLY CHAIN MANAGEMENT (PHCO) 2023 QUESTIONS AND ANSWERS 100% VERIFIED 1. A company that produces motors uses the following check sheet: Why would the company use this check sheet? YOUR ANSWER CORRECT ANSWER To create a control chart to measure the engine assembly process To create a flow chart of the engine assembly process To develop a suppliers, inputs, process, outputs, customers (SIPOC) diagram To develop a Par...
-
Test Bank for Applied Statistics I Basic Bivariate Techniques 3rd Edition by Rebecca M. Warner
- Exam (elaborations) • 273 pages • 2024
- £15.46
- + learn more
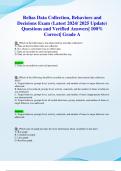
Test Bank for Applied Statistics I Basic Bivariate Techniques 3rd Edition by Rebecca M. Warner. 1. Evaluating Numerical Information 2. Basic Research Concepts 3. Frequency Distribution Tables 4. Descriptive Statistics 5. Graphs: Bar Charts, Histograms, and Boxplots 6. The Normal Distribution and z Scores 7. Sampling Error and Confidence Intervals 8. The One-Sample t Test 9. Issues in Significance Tests 10. Bivariate Pearson Correlation 11. Bivariate Regression 12. The Independent-Samples t Test ...
-
Relias Data Collection, Behaviors and Decisions Exam (Latest 2024/ 2025 Update) Questions and Verified Answers| 100% Correct| Grade A
- Exam (elaborations) • 12 pages • 2024
- £7.73
- + learn more
Relias Data Collection, Behaviors and Decisions Exam (Latest 2024/ 2025 Update) Questions and Verified Answers| 100% Correct| Grade A Q: Which of the following is true about trial by trial data collection? A. Data on the first three trials are collected. B. It is always a convenient way to collect data. C. Data are recorded on each trial presented. D. Data are always more accurate when collected this way. Answer: C. Data are recorded on each trial presented. Q: Which of the f...

-
BESC 3010 Practice Final Questions And Answers Graded A+.
- Exam (elaborations) • 20 pages • 2024
- £9.66
- + learn more
BESC 3010 Practice Final Questions And Answers Graded A+. In a sample of women, the number of children that each woman has is an example of which level of measurement? A. nominal B. ordinal C. interval D. ratio - correct answer.Ratio Remember with ratio you can have an absolute zero of something. Military ranks are an example of what level of measurement? A. nominal b. ordinal C. interval D. ratio - correct al; because one person has a higher rank than another but doesn...
-
AP Statistics Exam Review 2023 verified to pass
- Exam (elaborations) • 24 pages • 2023
- £14.30
- + learn more
AP Statistics Exam ReviewWhat is a dot plot? - correct answer A graphical display which shows "dots" for each point. It's good for categorical data- ie data classified into categories. What's the difference between categorical and quantitative data? - correct answer Categorical data fits into various categories; whereas, quantitative data has numerical values associated with it. What is a bar chart? - correct answer A display for categorical data which indicates frequencies or percents...

As you read this, a fellow student has made another £4

-
ASQ: Ch 13 Problem-Solving Tools (P 314 - 352) || with 100% Accurate Solutions.
- Exam (elaborations) • 31 pages • 2024
- £10.43
- + learn more
7 Classic Quality Tools correct answers Scientific tools for analyzing, communicating and improving process performance. They add efficiency & accuracy to data & decisions. 1. Flowchart 2. Control Charts 3. Histograms 4. Scatter Diagrams 5. Check Sheets 6. Pareto Diagram 7. Cause & Effect Diagram Flowchart Uses correct answers -Often starting process for process improvement -Document as-is condition of a process -Reflect changes to be made to a process (duplication, redundancies, c...

-
CQI Exam Questions and answers latest update
- Exam (elaborations) • 8 pages • 2024
- £8.27
- + learn more
CQI Exam Questions and answers latest update Define CQI STRUCTURED process where PEOPLE plan and carry out continuous IMPROVEMENTS in health care that meet or exceed EXPECTATIONS What is the difference between quality in industry and quality in healthcare? Healthcare is more complex Has greater attn to consumers Greater education/training in CQI for all staff Name some CQI tools Flow Charts Cause & Effect Histograms Pareto Charts Run Charts Control Charts Regression Analysi...
-
WGU D220 Healthcare Informatics Pre-test || With Questions & 100% Accurate Solutions
- Exam (elaborations) • 24 pages • 2024
- £10.05
- + learn more
WGU D220 Healthcare Informatics Pre-test || With Questions & 100% Accurate Solutions WGU D220 Healthcare Informatics Pre-test || With Questions & 100% Accurate Solutions Line graphs are used for-Quantatitive - ANSWER-showing change over time (blood pressure, temperature) Histograms are used for (Quantitive) - ANSWER-Showing quantitative data organised into classes (e.g. ages of people in years; 0-9, 10 -19, 20 - 29) Flu Virus by date of hospital admission The HITECH Act of 2009 prov...
-
WGU C207 Module Quizzes Multi Choice Version Data-Driven Decision Making
- Exam (elaborations) • 15 pages • 2024
- £10.43
- + learn more
For companies to attract and retain their best customers they need a complete portrait of who they are. To develop this portrait companies turn to... a. Statistics b. Analytics c. Management Science d. Histograms - Answer- b A manufacturer wants to maximize their factory output while specifically minimizing labor costs. What type of analytics might they employ to achieve this goal? a. Descriptive Analytics b. Predictive Analytics c. Prescriptive Analytics d. Diagnostic Analyti...
-
WGU C207 Data Driven Decision Making Quizzes Exam 20242025 Questions with 100% Correct Answers | Updated & Verified
- Exam (elaborations) • 54 pages • 2024
- £10.05
- + learn more
1. For companies to attract and retain their best customers they need a complete portrait of who they are. To develop this portrait companies turn to... A) Statistics B) Analytics C) Management Science D) Histograms ANS : B 2. (Quiz 1) 2. A manufacturer wants to maximize their factory output while specifically minimizing labor costs. What type of analytics might they employ to achieve this goal? A) Descriptive Analytics B) Predictive Analytics C) Prescriptive Analytics D) Diagnostic ...
