Scatterplot Samenvattingen, Aantekeningen en Examens
Op zoek naar een samenvatting over Scatterplot? Op deze pagina vind je 936 samenvattingen over Scatterplot.
Pagina 3 van de 936 resultaten
Sorteer op
-
WGU C955 - Module 5: Descriptive Statistics for Two Variables, Questions and answers, VERIFIED | 34 Pages
- Tentamen (uitwerkingen) • 34 pagina's • 2023
- €19,69
- + meer info
The relationship between the two variables on a scatterplot can be measured by what statistic? {{ Scatterplot of sales on the x-axis and profit index on the y-axis. }} a Correlation coefficient ( r ) b Regression c ANOVA d Chi-square - -Correlation coefficient ( r ) A study was completed to investigate if commutes of longer than 30 minutes increased the risk of burnout. The results of the study are in the table below. ,Lenth of Commute ,<30 Minutes ,>30 Minutes ,Total Risk of Burn...
-
Histograms and Scatterplots Questions and Answers 2023
- Tentamen (uitwerkingen) • 2 pagina's • 2023
- €15,36
- + meer info
Histograms and Scatterplots
-
EPPP Exam Questions and Answers Already Passed
- Tentamen (uitwerkingen) • 597 pagina's • 2024
- €14,88
- + meer info
EPPP Exam Questions and Answers Already Passed In which type of graph do the bars touch to indicate the overlapping nature of the data? a) bar graph b) histogram c) pie chart d) scatterplot histogram Which scale of measurement is dichotomous/categorical and does not have a sp order, equal intervals or an absolute zero? a) nominal b) ordinal c) interval d) ratio nominal Which scale of measurement would be used to measure the places achieved in a horse race? a) nominal b) or...
-
WGU C955 - Module 5: Descriptive Statistics for Two Variables with Complete Solutions
- Tentamen (uitwerkingen) • 15 pagina's • 2023
- €11,04
- + meer info
WGU C955 - Module 5: Descriptive Statistics for Two Variables with Complete Solutions WGU C955 - Module 5: Descriptive Statistics for Two Variables with Complete Solutions WGU C955 - Module 5: Descriptive Statistics for Two Variables with Complete Solutions The relationship between the two variables on a scatterplot can be measured by what statistic? {{ Scatterplot of sales on the x-axis and profit index on the y-axis. }} a Correlation coefficient ( r ) b Regression c A...
-
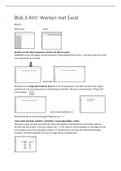
AVV Blok 3 Werken met Excel Bachelor 1
- Samenvatting • 33 pagina's • 2022
- €6,49
- 19x verkocht
- + meer info
In deze samenvatting worden stap voor stap per week alle colleges samengevat en uitgelegd. Met voorbeelden, aanwijzingen waar je dingen kunt vinden, uitleg van de formules en ook de bijbehorende literatuur zit erbij.

Teveel maand over aan het eind van je geld?

-
Statistics Exam Study Questions and Answers 100% Verified Graded A 2024
- Tentamen (uitwerkingen) • 11 pagina's • 2024
- €12,00
- + meer info
Positive correlation - As one variable increases, the other variable increases Negative correlation - As one variable increases, the other decreases A point on the scatter plot represents how many values? - 2 (X and Y) Relationship between linear and scatter plot diagrams? - The regression line is the best-fitting line through a scatter plot If you see the notation (E X)(E Y) what should you do? - First sum the Xs, then sum the Ys, then multiply the sums If you see the notation E ...
-
QM2 - Test 2 || All Correct.
- Tentamen (uitwerkingen) • 6 pagina's • 2024
- €10,08
- + meer info
A scatterplot shows: correct answers Scores on one variable plotted against scores on a second variable. Which of the following statements about Pearson's correlation coefficient is not true? correct answers It cannot be used with binary variables (those taking on a value of 0 or 1). When interpreting a correlation coefficient, it is important to look at: correct answers All of these. a. The magnitude of the correlation coefficient. b. All of these. c. The significance of the correlati...
-
WGU C955 - Module 5: Descriptive Statistics for Two Variables Questions and Answers with complete solution
- Tentamen (uitwerkingen) • 22 pagina's • 2023
- €11,04
- + meer info
The relationship between the two variables on a scatterplot can be measured by what statistic? {{ Scatterplot of sales on the x-axis and profit index on the y-axis. }} a Correlation coefficient ( r ) b Regression c ANOVA d Chi-square - Answer Correlation coefficient ( r ) A study was completed to investigate if commutes of longer than 30 minutes increased the risk of burnout. The results of the study are in the table below. ,Lenth of Commute ,<30 Minutes ,>30 Minutes ,Total Risk o...
-
WGU C955 - Module 5: Descriptive Statistics for Two Variables Exam Questions And Answers
- Tentamen (uitwerkingen) • 15 pagina's • 2023
- €12,00
- + meer info
WGU C955 - Module 5: Descriptive Statistics for Two Variables Exam Questions And Answers The relationship between the two variables on a scatterplot can be measured by what statistic? {{ Scatterplot of sales on the x-axis and profit index on the y-axis. }} a Correlation coefficient ( r ) b Regression c ANOVA d Chi-square - ANS Correlation coefficient ( r ) A study was completed to investigate if commutes of longer than 30 minutes increased the risk of burnout. The results of th...
-
WGU C955 - Module 5 Descriptive Statistics for Two Variables Exam Questions With Correct Answers
- Tentamen (uitwerkingen) • 23 pagina's • 2024
- €12,00
- + meer info
The relationship between the two variables on a scatterplot can be measured by what statistic? {{ Scatterplot of sales on the x-axis and profit index on the y-axis. }} a Correlation coefficient ( r ) b Regression c ANOVA d Chi-square - Answer Correlation coefficient ( r ) A study was completed to investigate if commutes of longer than 30 minutes increased the risk of burnout. The results of the study are in the table below. ,Lenth of Commute ,<30 Minutes ,>30 Minutes ,Tota...
