Unimodal Samenvattingen, Aantekeningen en Examens
Op zoek naar een samenvatting over Unimodal? Op deze pagina vind je 181 samenvattingen over Unimodal.
Alle 181 resultaten
Sorteer op
-
NURS 5366 week 5 Nursing Research Statistics QUESTIONS AND ANSWERS 100% Accuracy, latest 2024
- Tentamen (uitwerkingen) • 20 pagina's • 2024
- €7,08
- + meer info
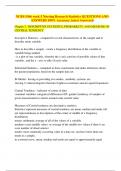
How to describe a sample Inferential Statistics Bi Modal Central TendencyMultimodal having more than 2 modes Unimodal When distribution only has one mode -the frequencies progressively decline as they move away from the mode. Symmetrical distributions are usually uni modal. bimodal means you have not defined your population if you find a bimodal Mode most frequently occurring measure (value or category) in (distribution) data Mean called location parameter most frequen...
-
Business (Intelligence) Analytics Final Exam 2024 || All Questions & Solutions (Rated A+)
- Tentamen (uitwerkingen) • 19 pagina's • 2024
- €10,87
- + meer info
Business (Intelligence) Analytics Final Exam 2024 || All Questions & Solutions (Rated A+) Business (Intelligence) Analytics Final Exam 2024 || All Questions & Solutions (Rated A+) Histogram - ANSWER - a graph for a quantitative variable; we usually slice up all the possible values into bins and then count the number of cases that fall in each bin Relative frequency histograms - ANSWER - percentages of each bin in the histogram Stem-and-leaf displays - ANSWER - are like histograms, but ...
-
AP Statistics Exam Review Questions With Complete Solutions
- Tentamen (uitwerkingen) • 33 pagina's • 2023
- €12,28
- + meer info
What is a dotplot? correct answer: A graphical display which shows "dots" for each point. It's good for categorical data- ie data classified into categories. What's the difference between categorical and quantitative data? correct answer: Categorical data fits into various categories; whereas, quantitative data has numerical values associated with it. What is a bar chart? correct answer: A display for categorical data which indicates frequencies or percents for each category. Wha...
-
STA 2381 Cumulative Exam |Questions with Correct Verified Answers
- Tentamen (uitwerkingen) • 35 pagina's • 2024
- €12,43
- + meer info
T/F: Every estimator has a sampling distribution that is identical to the distribution of the population of interest - ANSWER False T/F: Chebychev's Theorem is used to help understand the concept of a standard deviation and applies to any random variable - ANSWER True T/F: The empirical rule is used to help understand the concept of the location of a population and applies only to symmetric unimodal continuous random variables - ANSWER False T/F: The empirical rule is used to help underst...
-
NURS 5366 Week 5 Nursing Research Statistics Questions and Answers 100%Accuracy, Latest 2024.
- Tentamen (uitwerkingen) • 17 pagina's • 2024
- €10,39
- + meer info
NURS 5366 Week 5 Nursing Research Statistics Questions and Answers 100%Accuracy, Latest 2024. Chapter 3 - DESCRIPTIVE STATISTICS, PROBABILITY, AND MEASURE OF CENTRAL TENDENCY descriptive Statistics - computed to reveal characteristics of the sample and to describe study variable How to describe a sample - create a frequency distribution of the variable or variable being studied - is a plot of one variable, whereby the x-axis consists of possible values of that variable , and the y - axis...

Wil jij je uitgaves terugverdienen?

-
NURS 5366 week 5 Nursing Research Statistics QUESTIONS AND ANSWERS 100% Accuracy, latest Answered
- Tentamen (uitwerkingen) • 16 pagina's • 2024
- €7,56
- + meer info
NURS 5366 week 5 Nursing Research Statistics QUESTIONS AND ANSWERS 100% Accuracy, latest Answered-Chapter 3 - DESCRIPTIVE STATISTICS, PROBABILITY, AND MEASURE OF CENTRAL TENDENCY descriptive Statistics - computed to reveal characteristics of the sample and to describe study variable How to describe a sample - create a frequency distribution of the variable or variable being studied - is a plot of one variable, whereby the x-axis consists of possible values of that variable , and the y - ...

-
STA 2381- Statistics Exam | Questions with Correct Verified Answers
- Tentamen (uitwerkingen) • 12 pagina's • 2024
- €11,81
- + meer info
T/F: Every estimator has a sampling distribution that is identical to the distribution of the population of interest - ANSWER False T/F: Chebychev's Theorem is used to help understand the concept of a standard deviation and applies to any random variable - ANSWER True T/F: The empirical rule is used to help understand the concept of the location of a population and applies only to symmetric unimodal continuous random variables - ANSWER False

-
NURS 5366 Week 5 Nursing Research Statistics Questions and Answers 100%Accuracy, Latest 2024.
- Tentamen (uitwerkingen) • 17 pagina's • 2024
- €10,87
- + meer info
NURS 5366 Week 5 Nursing Research Statistics Questions and Answers 100%Accuracy, Latest 2024. Chapter 3 - DESCRIPTIVE STATISTICS, PROBABILITY, AND MEASURE OF CENTRAL TENDENCY descriptive Statistics - computed to reveal characteristics of the sample and to describe study variable How to describe a sample - create a frequency distribution of the variable or variable being studied - is a plot of one variable, whereby the x-axis consists of possible values of that variable , and the y - axis...
-
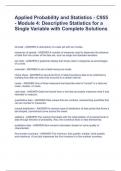
Applied Probability and Statistics - C955 - Module 4: Descriptive Statistics for a Single Variable with Complete Solutions
- Tentamen (uitwerkingen) • 3 pagina's • 2023
- €9,45
- + meer info
Applied Probability and Statistics - C955 - Module 4: Descriptive Statistics for a Single Variable with Complete Solutions Applied Probability and Statistics - C955 - Module 4: Descriptive Statistics for a Single Variable with Complete Solutions Applied Probability and Statistics - C955 - Module 4: Descriptive Statistics for a Single Variable with Complete Solutions bimodal - ANSWER-A description of a data set with two modes. measures of spread - ANSWER-A number of measures used to d...
