Tukey Samenvattingen, Aantekeningen en Examens
Op zoek naar een samenvatting over Tukey? Op deze pagina vind je 48 samenvattingen over Tukey.
Alle 48 resultaten
Sorteer op
-
NSG-522 Midterm Questions And Answers
- Tentamen (uitwerkingen) • 11 pagina's • 2023
- €11,39
- 1x verkocht
- + meer info
The frequency and relative frequency presented as a percentage should both be reported when describing interval level data - Answer- False What type of graphic display would be the best for a variable measured at the ordinal data? - Answer- Histogram The operational definition of a variable - Answer- Specifies how a variable should be measured The epidemiological range is - Answer- the minimum and maximum values When reporting the mean for a variable, what measure of spread should be...
-
EDUC 812 module 4 Quiz: ANOVA with Tukey (Liberty university)
- Overig • 10 pagina's • 2023
- €18,52
- + meer info
If eta squared equals .002, then the effect size is medium. True False Q 2 / 2 pts uestion 2 An Analysis of Variance (ANOVA) demonstrated the following results, F(2, 27) = 5.56, p = .007. What can be concluded based on these results? Post hoc analysis must be conducted Post hoc analysis does not need to be conducted Qu 2 / 2 pts estion 3 The result of an One-Way ANOVA for total teacher burnout among four groups of teachers was F(3, 117) = 3.82, p = .02. The corresponding effect size wa...
-
Social Media Marketing Certification Stukent (Key concepts of all the chapters in the Stukent Social Media Marketing Course.) Questions With Correct Solutions.
- Tentamen (uitwerkingen) • 9 pagina's • 2023
- €13,29
- + meer info
Social Media Marketing Certification Stukent (Key concepts of all the chapters in the Stukent Social Media Marketing Course.) Questions With Correct Solutions.
-
Test Bank for Statistics Alive!, 3rd Edition by Wendy J. Steinberg
- Tentamen (uitwerkingen) • 324 pagina's • 2022
- €37,52
- 1x verkocht
- + meer info
Test Bank for Statistics Alive! 3e 3rd Edition by Wendy J. Steinberg, Matthew Price. ISBN-13: 8263 Full Chapters test bank included Module 1. Math Review, Vocabulary, and Symbols Getting Started Common Terms and Symbols in Statistics Fundamental Rules and Procedures for Statistics More Rules and Procedures Module 2. Measurement Scales What Is Measurement? Scales of Measurement Continuous Versus Discrete Variables Real Limits PART II. TABLES AND G...
-
EPI 522 Midterm Quiz Summary- Rush University 2023/24
- Tentamen (uitwerkingen) • 20 pagina's • 2023
- €18,04
- + meer info
EPI 522 Midterm Quiz Summary- Rush University 2023/24 Height recorded in centimeters should be displayed using SELECT ALL THAT APPLY Bar chart. Box-and-whisker plot. Stem-and-leaf plot. Histogram. Question 2 The dependent variable is The intervention being studied. The experiemental variable. The variable manipulated by the researcher. The outcome variable. Question 3 A student is planning on conducting a quality improvement project on a unit in the university hospital where the s...


-
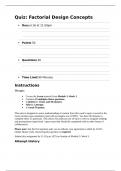
PSCYHOLOGY PSYC 515 Week 3 Quiz: Factorial Design Concepts.
- Tentamen (uitwerkingen) • 18 pagina's • 2023
- €13,77
- + meer info
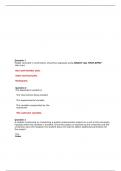
PSCYHOLOGY PSYC 515 Week 3 Quiz: Factorial Design Concepts Score for this quiz: 50 out of 50 Submitted Jul 10 at 4:35am This attempt took 33 minutes. Question 1 0 / 0 pts I have read and understand the Academic Honor policy as outlined in the Online Honor Code for Liberty University Online. I agree to abide by this policy and that the work submitted herein is my own. Yes No Question 2 2 / 2 pts In a study examining the effects of gender (male or female) and major (psychology, computer s...
-
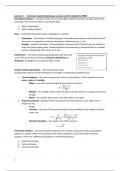
Summary Experimental Research Methods: extensive summary with images & examples!
- Samenvatting • 36 pagina's • 2023
- €10,89
- 3x verkocht
- + meer info
A very extensive summary of the course Experimental Research Methods. All of the information & visualizations are representations of and based on all of the study materials of the course ERM of Tilburg University. All of the tables/text with a black striped border are examples of questions/calculations. Everything with a think blue border is about SPSS and all small text boxes with a black border is a repetition of information or additional information. If you have any questions/remarks fee...

-
PSCYHOLOGY PSYC 515 Week 3 Quiz: Factorial Design Concepts.
- Tentamen (uitwerkingen) • 19 pagina's • 2024
- €13,30
- + meer info
PSCYHOLOGY PSYC 515 Week 3 Quiz: Factorial Design Concepts Score for this quiz: 50 out of 50 Submitted Jul 10 at 4:35am This attempt took 33 minutes. Question 1 0 / 0 pts I have read and understand the Academic Honor policy as outlined in the Online Honor Code for Liberty University Online. I agree to abide by this policy and that the work submitted herein is my own. Yes No Question 2 2 / 2 pts In a study examining the effects of gender (male or female) and major (psychology, computer science, p...
-
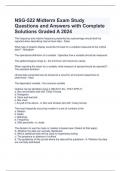
NSG-522 Midterm Exam Study Questions and Answers with Complete Solutions Graded A 2024
- Tentamen (uitwerkingen) • 11 pagina's • 2024
- €10,92
- + meer info
The frequency and relative frequency presented as a percentage should both be reported when describing interval level data - False What type of graphic display would be the best for a variable measured at the ordinal data? - Histogram The operational definition of a variable - Specifies how a variable should be measured The epidemiological range is - the minimum and maximum values When reporting the mean for a variable, what measure of spread should be reported? - The standard deviat...
