Quallys Samenvattingen, Aantekeningen en Examens
Op zoek naar een samenvatting over Quallys? Op deze pagina vind je 12 samenvattingen over Quallys.
Alle 12 resultaten
Sorteer op
-
DISTINCTION - BTEC Applied Science Unit 13 Applications of Inorganic Chemistry LA C - Investigate practically a range of reactions involving solutions of transition metal ions in order to understand the basis for their qualitative analysis.
- Overig • 14 pagina's • 2022
- €13,37
- 17x verkocht
- + meer info
DISTINCTION LEVEL - BTEC Applied Science Unit 13 Applications of Inorganic Chemistry LA C - Investigate practically a range of reactions involving solutions of transition metal ions in order to understand the basis for their qualitative analysis.
-
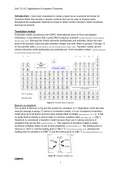
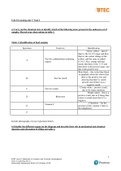
Unit 13A3 Learning aim C: Investigate practically a range of reactions involving solutions of transition metal ions in order to understand the basis for their qualitative analysis
- Essay • 12 pagina's • 2022
- €20,67
- 6x verkocht
- + meer info
Learning Aim C: Investigate practically a range of reactions involving solutions of transition metal ions in order to understand the basis for their qualitative analysis P7, P8,M6, D3 achieved
-
Wk2AssignTedrowW.docx 1 Visually Displaying Data Results Walden University RSCH 8210: Quantitative Reasoning and Analysis 14:08:14 GMT -05:00 Visually Displaying Data Results Categorical Variable Using the Afrobarometer data set, with a mean age
- Samenvatting • 4 pagina's • 2022
- €7,20
- + meer info
Wk2AssignTedrowW.docx 1 Visually Displaying Data Results Walden University RSCH 8210: Quantitative Reasoning and Analysis 14:08:14 GMT -05:00 Visually Displaying Data Results Categorical Variable Using the Afrobarometer data set, with a mean age of 37.23, the first variable selected for visual display is the Urban or Rural Primary Sampling Unit. This is a categorical variable because all responses fall into urban, rural, or semi-urban categories. Each response carries the same weight ma...
-
HA425 Unit 2 Assignment FINAL.docx Healthcare Quality Improvement Purdue University Global HA245 Operational Analysis and Quality Improvement Quality improvement (QI) in healthcare is the framework used to systematically identify and provide strateg
- Samenvatting • 8 pagina's • 2021
- €4,79
- 1x verkocht
- + meer info
HA425 Unit 2 Assignment FINAL.docx Healthcare Quality Improvement Purdue University Global HA245 Operational Analysis and Quality Improvement Quality improvement (QI) in healthcare is the framework used to systematically identify and provide strategies to improve quality of patient care (œModule 4. Approaches, 2013). With this is mind, healthcarequality has changed over the past centurywith advances in technology and the delivery of patient care. The history of healthcare quality began ...

-
WK2Assgn.DraytonS.docx Quantitative Analysis: Visually Displaying Data Results RSCH 8210 A-Quantitative Reasoning and Analysis Walden University 14:48:34 GMT -05:00 The high school longitudinal study data set was used to identify two variables and
- Samenvatting • 5 pagina's • 2022
- €7,20
- + meer info
WK2Assgn.DraytonS.docx Quantitative Analysis: Visually Displaying Data Results RSCH 8210 A-Quantitative Reasoning and Analysis Walden University 14:48:34 GMT -05:00 The high school longitudinal study data set was used to identify two variables and visually display them for comparison. In order to visually display each variable a graph of some sort is needed. The mean of the variable X1SES (Socio-economic status composite) is .0355 displayed below in figure 1. Figure 1 The analyzation o...

Teveel maand over aan het eind van je geld?


-
WK2Assgn.DraytonS.docx Quantitative Analysis: Visually Displaying Data Results RSCH 8210 A-Quantitative Reasoning and Analysis Walden University 14:48:34 GMT -05:00 The high school longitudinal study data set was used to identify two variables and
- Samenvatting • 5 pagina's • 2022
- €7,20
- + meer info
WK2Assgn.DraytonS.docx Quantitative Analysis: Visually Displaying Data Results RSCH 8210 A-Quantitative Reasoning and Analysis Walden University 14:48:34 GMT -05:00 The high school longitudinal study data set was used to identify two variables and visually display them for comparison. In order to visually display each variable a graph of some sort is needed. The mean of the variable X1SES (Socio-economic status composite) is .0355 displayed below in figure 1. Figure 1 The analyzation o...

-
Wk2AssignTedrowW.docx 1 Visually Displaying Data Results Walden University RSCH 8210: Quantitative Reasoning and Analysis 14:08:14 GMT -05:00 Visually Displaying Data Results Categorical Variable Using the Afrobarometer data set, with a mean age
- Samenvatting • 4 pagina's • 2022
- €7,20
- + meer info
Wk2AssignTedrowW.docx 1 Visually Displaying Data Results Walden University RSCH 8210: Quantitative Reasoning and Analysis 14:08:14 GMT -05:00 Visually Displaying Data Results Categorical Variable Using the Afrobarometer data set, with a mean age of 37.23, the first variable selected for visual display is the Urban or Rural Primary Sampling Unit. This is a categorical variable because all responses fall into urban, rural, or semi-urban categories. Each response carries the same weight ma...
-
SWOT Analysis BUS-FP4993 Abstract SWOT analysis presents four-ways to look at oneself or an organization it is usually drawn and divided into with four-squares with Strength and Weaknesses at the top and Opportunities and Threats at the bottom. The ana
- Samenvatting • 10 pagina's • 2021
- €3,35
- + meer info
SWOT Analysis BUS-FP4993 Abstract SWOT analysis presents four-ways to look at oneself or an organization it is usually drawn and divided into with four-squares with Strength and Weaknesses at the top and Opportunities and Threats at the bottom. The analysis of SWOT is to €œget it down on paper €, what your internal strengths and weaknesses are and these are within your direct control and to then look at your external opportunities and threats and these are based on outside factors th...
-
HA425Unit3Assignment.docx Historical Evolution of Healthcare HA425 Operational Analysis and Quality Improvement Purdue Global University Introduction Quality improvement programs were not initially intended for the healthcare system, but for the
- Samenvatting • 3 pagina's • 2021
- €4,79
- + meer info
HA425Unit3A Historical Evolution of Healthcare HA425 Operational Analysis and Quality Improvement Purdue Global University Introduction Quality improvement programs were not initially intended for the healthcare system, but for the manufacturing industry. The healthcare organization quickly saw this as an opportunity to use those same models to improve their own systems. You can define health care quality as a system of healthcare services for individuals that increase the likelihood of...
-
c489_Task_2 Organizational Systems and Quality Leadership Task 2 RCA and FMEA A. Root Cause Analysis A root cause analysis (RCA) is essentially a method used to look back at a particularly negative event and to identify flaws or factors that contributed
- Samenvatting • 14 pagina's • 2020
- €7,20
- + meer info
c489_Task_2 Organizational Systems and Quality Leadership Task 2 RCA and FMEA A. Root Cause Analysis A root cause analysis (RCA) is essentially a method used to look back at a particularly negative event and to identify flaws or factors that contributed to this event that can be adjusted for future prevention. In the healthcare system it can be easy to put blame on a person for an event going wrong, however that does nothing to help prevent further incidences. Focusing on a cause instead o...
