Pooled sample variance Samenvattingen, Aantekeningen en Examens
Op zoek naar een samenvatting over Pooled sample variance? Op deze pagina vind je 67 samenvattingen over Pooled sample variance.
Alle 67 resultaten
Sorteer op
 Populair
-
Solutions for Essentials of Econometrics, 5th Edition by Damodar N. Gujarati
- Tentamen (uitwerkingen) • 228 pagina's • 2023
- €37,76
- 1x verkocht
- + meer info
Complete Solutions Manual for Essentials of Econometrics 5e 5th Edition by Damodar N. Gujarati. Full Chapters Solutions are included. Chapter 1 to 12 - Appendixes Solutions are included. Chapter 1. The Nature and Scope of Econometrics 1.1 What Is Econometrics? 1.2 Why Study Econometrics? 1.3 The Methodology Of Econometrics 1.4 The Road Ahead Key Terms and Concepts Questions Problems Appendix 1A: Economic Data on the World Wide Web PART I. THE LINEAR REGRES...
 Populair
-
Solution Manual for Design and Analysis of Experiments, 10th Edition
- Tentamen (uitwerkingen) • 710 pagina's • 2024 Populair
- €38,14
- 1x verkocht
- + meer info
Solution Manual for Design and Analysis of Experiments, 10th Edition Solutions from Montgomery, D. C. (2019) Design and Analysis of Experiments, Wiley, NY 1-1 Chapter 1 Introduction Solutions 1.1S. Suppose that you want to design an experiment to study the proportion of unpopped kernels of popcorn. Complete steps 1-3 of the guidelines for designing experiments in Section 1.4. Are there any major sources of variation that would be difficult to control? Step 1 – Recognition of and s...
-
ISYE 6414 Regression Modules 1-2 (2023/2024) Already Passed
- Tentamen (uitwerkingen) • 13 pagina's • 2023
- €9,55
- + meer info
ISYE 6414 Regression Modules 1-2 (2023/2024) Already Passed Assuming that the data are normally distributed, under the simple linear model, the estimated variance has the following sampling distribution: Chi-squared with n-2 degrees of freedom. The fitted values are defined as? The regression line with parameters replaced with the estimated regression coefficients. The estimators fo the linear regression model are derived by? Minimizing the sum of squared differences between the observed and ...
-
ISYE 6414 Midterm Prep Questions and Answers Graded A+
- Tentamen (uitwerkingen) • 13 pagina's • 2023
- €9,55
- + meer info
ISYE 6414 Midterm Prep Questions and Answers Graded A+ We can assess the constant variance assumption in linear regression by plotting the residuals vs. fitted values. True If one confidence interval in the pairwise comparison in ANOVA includes zero, we conclude that the two corresponding means are plausibly equal. True The assumption of normality is not required in linear regression to make inference on the regression coefficients. False (Explanation: is required) We cannot estimate a multi...
-
QMB 3200 Bliss Final (with Mindtap Flashcards Questions & Answers 100% Accurate!!
- Tentamen (uitwerkingen) • 10 pagina's • 2024
- €11,46
- + meer info
Treatments - ANSWERSDifferent Levels of a factor Response Variable - ANSWERSAnother word for the dependent variable of interest. Factor - ANSWERSAnother word for the independent variable of interest. Anova Table - ANSWERSA table used to summarize the analysis of variance computations and results. It contains columns showing the source of variation, the sum of squares, the degrees of freedom, the mean square, the F value(s), and the p-value(s). Analysis of Variance (ANOVA) - ANSWERSca...

Teveel maand over aan het eind van je geld?

-
Psych 355 Exam 1 with Verified Answers
- Tentamen (uitwerkingen) • 16 pagina's • 2023
- €8,50
- + meer info
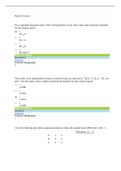
Psych 355 Exam 1 For a repeated-measures study, if the null hypothesis is true, then what value should be obtained for the sample mean? a. MD > 0 b. MD = 0 c. MD < 0 d. MD near 0 Hide Feedback Incorrect Solution Correct Response d The results of an independent-measures research study are reported as “t(22) = 2.12, p < .05, two tails.” For this study, what t values formed the boundaries for the critical region? a. ±2.080 b. ±2.064 c. ±2.074 d. ±2.069 Hid...
-
STATS 250 Final Exam Solutions | Complete Rated A+ 2023
- Tentamen (uitwerkingen) • 12 pagina's • 2023
- €15,29
- + meer info
STATS 250 Final Exam Solutions | Complete Rated A+ 2023. When evaluating loan applicants for approval of a loan, banks examine several aspects of an applicant’s financial history. One aspect that is considered during the loan application process is the applicant’s credit score. We would like to assess if the population mean credit score for successful loan applicants is greater than the population mean credit score for applicants who were denied the loan, H0: µ1 = µ2 versus Ha: µ1 &g...
-
Grand Canyon University - HLT 362V / HLT 362 Week 3 Quiz Rated A+
- Tentamen (uitwerkingen) • 4 pagina's • 2022
- €9,07
- 1x verkocht
- + meer info
1. If you are conducting a study on the impacts of diet and exercise on high blood pressure and you take a proportional sample based upon race/ethnicity, this would be an example of: ok Simple random sample Cluster sampling Stratified sampling Convenience sampling 2. If a researcher does not select the appropriate level of significance (alpha) based upon prior research or industry standard and concludes that the study found a statistical difference when in fact there was no differenc...

-
Data Analysis with Microsoft Excel.
- Tentamen (uitwerkingen) • 613 pagina's • 2023
- €33,94
- + meer info
Data Analysis with Microsoft Excel. Introduction Data Analysis with Microsoft® Excel: Updated for Offi ce 2007® harnesses the power of Excel and transforms it into a tool for learning basic statistical analysis. Students learn statistics in the context of analyzing data. We feel that it is important for students to work with real data, analyzing real-world problems, so that they understand the subtleties and complexities of analysis that make statistics such an integral part of underst...
-
Statistics for Management and Economics 11e Keller SM TestBank
- Tentamen (uitwerkingen) • 862 pagina's • 2022
- €15,01
- + meer info
Statistics for Management and Economics 11e Keller SM Statistics for Management and Economics 11e Keller SM331 Appendix 13 A13.1 Equal-variances t-test of µ1 - µ2 H0: (µ1 - µ2) = 0 H1: (µ1 - µ2) < 0 1 2 3 4 5 6 7 8 9 10 11 12 13 14 A B C t-Test: Two-Sample Assuming Equal Variances This Year 3 Years Ago Mean 8.29 10.36 Variance 8.13 8.43 Observations 100 100 Pooled Variance 8.28 Hypothesized Mean Difference 0 df 198 t Stat -5.09 P(T<=t) one-tail 0.0000 t Cri...
