Multicollinearity Samenvattingen, Aantekeningen en Examens
Op zoek naar een samenvatting over Multicollinearity? Op deze pagina vind je 167 samenvattingen over Multicollinearity.
Alle 167 resultaten
Sorteer op
-
ECS3706 Assignment 2 (ANSWERS) Semester 2 2023 - DISTINCTION GUARANTEED.
- Tentamen (uitwerkingen) • 10 pagina's • 2023
- €2,59
- 10x verkocht
- + meer info
Well-structured ECS3706 Assignment 2 (ANSWERS) Semester 2 2023 - DISTINCTION GUARANTEED.. (DETAILED ANSWERS - DISTINCTION GUARANTEED!). QUESTION A1 (15 marks) (a) One of the most challenging concepts to master in this module is distinguishing between the stochastic error term and the residual. List three differences between the stochastic error term and the residual (3) (b) Explain in detail how Ordinary Least Squares (OLS) works in estimating the coefficients of a linear regression model. (3)...
-
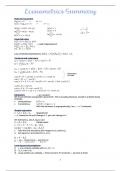
Econometrics Summary - ENDTERM UVA EBE
- Samenvatting • 10 pagina's • 2023
- €7,49
- 1x verkocht
- + meer info
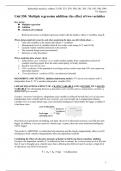
This document is a summary of everything you need to know for the endterm (and midterm) of the course 'Econometrics' (6012B0453Y) at the University of Amsterdam, taught by Hans van Ophem. This document includes the following topics: log and ln, expected value, variance, covariance, estimators, simple regression, least squares, gauss-markov, homoskedasticity, TSS, SSR, ESS, R^2, hypothesis testing,multiple regression, adjusted R^2, omitted variable bias, functional form, multicollinearity, SER, i...
-
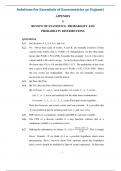
Solutions for Essentials of Econometrics, 5th Edition by Damodar N. Gujarati
- Tentamen (uitwerkingen) • 228 pagina's • 2023
- €37,76
- 1x verkocht
- + meer info
Complete Solutions Manual for Essentials of Econometrics 5e 5th Edition by Damodar N. Gujarati. Full Chapters Solutions are included. Chapter 1 to 12 - Appendixes Solutions are included. Chapter 1. The Nature and Scope of Econometrics 1.1 What Is Econometrics? 1.2 Why Study Econometrics? 1.3 The Methodology Of Econometrics 1.4 The Road Ahead Key Terms and Concepts Questions Problems Appendix 1A: Economic Data on the World Wide Web PART I. THE LINEAR REGRES...
-
ECS3706-Econometrics Summary Notes.
- Samenvatting • 111 pagina's • 2022
- €4,30
- 5x verkocht
- + meer info
ECS3706-Econometrics Summary Notes. LEARNING UNIT 1: An overview of regression analysis 1.1 What is econometrics? 1.2 Uses of econometrics 1.3 What is regression analysis? 1.4 A simple example of regression analysis 1.5 Using regression analysis to explain housing prices LEARNING UNIT 2: Ordinary least squares (OLS) 2.1 Estimating single-independent-variable models with OLS 2.2 Estimating multivariate regression models with OLS 2.3 Evaluating the quality of a regression equation 2.4 De...
-
Comprehensive summary Inferential Statistics test 2 + R codes
- Samenvatting • 60 pagina's • 2023 Populair
- €11,99
- 5x verkocht
- + meer info
A comprehensive summary for Inferential Statistics test 2 including units 550, 553, 554, 560, 561, 563, 510, 545, 548, 591, based on the microlectures, lectures and assignments + R codes (own grade: 8.8)

Teveel maand over aan het eind van je geld?


-
Econometrics Final Exam Questions and Answers 100% Pass Verified & Updated
- Tentamen (uitwerkingen) • 37 pagina's • 2024
- €13,85
- + meer info
Econometrics Final Exam Questions and Answers 100% Pass Verified & Updated perfect multicollinearity -Answer--violates classical assumption VI (no ind var is a perfect linear function of one or more other ind vars) --if 2 exp vars are related then OLS computer program will find it difficult to distinguish effects of one var from the effects of another -variation in one exp var can be completely explained by movements in another exp var X₁ᵢ=

-
WGU C207 Data-Driven Decision-Making Exam (NEW 2023/ 2024 Update) Questions and Verified Answers- 100% Correct
- Tentamen (uitwerkingen) • 32 pagina's • 2023
- €10,51
- + meer info
WGU C207 Data-Driven Decision-Making Exam (NEW 2023/ 2024 Update) Questions and Verified Answers- 100% Correct QUESTION a comparison of the same quantity of goods with the same weight over a period of time Answer: Laspeyres Index QUESTION A graph that illustrates relationships between two changing variables with a line or curve that connects a series of successive data points Answer: Line graph QUESTION The minimum value on a control chart that a process...
-
Econometrics Final Exam Questions and Answers 100% Pass Verified & Updated
- Tentamen (uitwerkingen) • 37 pagina's • 2024
- €12,90
- + meer info
Econometrics Final Exam Questions and Answers 100% Pass Verified & Updated perfect multicollinearity -Answer--violates classical assumption VI (no ind var is a perfect linear function of one or more other ind vars) --if 2 exp vars are related then OLS computer program will find it difficult to distinguish effects of one var from the effects of another -variation in one exp var can be completely explained by movements in another exp var X₁ᵢ=
-
WGU C207 Pre- Assessment Data-Driven Decision-Making Exam (NEW 2023/ 2024 Update) Questions and Verified Answers- 100% Correct| Grade A
- Tentamen (uitwerkingen) • 23 pagina's • 2023
- €10,03
- + meer info
WGU C207 Pre- Assessment Data-Driven Decision-Making Exam (NEW 2023/ 2024 Update) Questions and Verified Answers- 100% Correct| Grade A A company decides to auction excess inventory on an auction website. The company has performed a regression analysis to identify how the length of the auction impacts the final price. Which statistic indicates the strength of the relation ship between the length of the auction and final price? F-statistic P-value R-squared Z-score Answer: R-squared...
-
UCF QMB 3200 Final Exam Verified Questions with Correct Answers Graded A+
- Tentamen (uitwerkingen) • 24 pagina's • 2024
- €11,95
- + meer info
UCF QMB 3200 Final Exam Verified Questions with Correct Answers Graded A+ A variable that cannot be measured in numerical terms is called a _____. a. dependent variable b. constant variable c. qualitative variable d. non-measurable random variable c. qualitative variable The difference between the observed value of the dependent variable and the value predicted by using the estimated regression equation is the _____. a. standard error b. residual c. predicted interval d. variance b. ...
