Boxplots Samenvattingen, Aantekeningen en Examens
Op zoek naar een samenvatting over Boxplots? Op deze pagina vind je 119 samenvattingen over Boxplots.
Populaire samengevatte studieboeken 'Boxplots'
Alle 119 resultaten
Sorteer op
 Populair
-
Test Bank for Applied Statistics I, Basic Bivariate Techniques, 3rd Edition Warner (All Chapters included)
- Tentamen (uitwerkingen) • 274 pagina's • 2023
- €37,41
- 2x verkocht
- + meer info
Complete Test Bank for Applied Statistics I, Basic Bivariate Techniques, 3rd Edition by Rebecca M. Warner ; ISBN13: 9781506352800. (Full Chapters included Chapter 1 to 18)..... 1. Evaluating Numerical Information. 2. Basic Research Concepts. 3. Frequency Distribution Tables. 4. Descriptive Statistics. 5. Graphs: Bar Charts, Histograms, and Boxplots. 6. The Normal Distribution and z Scores. 7. Sampling Error and Confidence Intervals. 8. The One-Sample t test: Introduction to Statistical S...

-
Introductory Statistics: Exploring the World Through Data 3rd Edition by Gould Robert, Wong Rebecca & Ryan Colleen. (Complete 14 Chapters). TEST BANK
- Tentamen (uitwerkingen) • 2 pagina's • 2023
- €25,99
- 1x verkocht
- + meer info
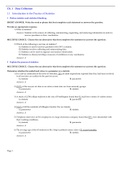
TEST BANK for Introductory Statistics: Exploring the World Through Data 3rd Edition by Gould Robert, Wong Rebecca & Ryan Colleen. TABLE OF CONTENTS_ 1. Introduction to Data 1.1 What Are Data? 1.2 Classifying and Storing Data 1.3 Investigating Data 1.4 Organizing Categorical Data 1.5 Collecting Data to Understand Causality 2. Picturing Variation with Graphs 2.1 Visualizing Variation in Numerical Data 2.2 Summarizing Important Features of a Numerical Distribution 2.3 Visualizing Variation in Categ...
-
Test Bank for Fundamentals of Statistics, 6th edition by Michael Sullivan
- Tentamen (uitwerkingen) • 350 pagina's • 2022
- €37,41
- 7x verkocht
- + meer info
Test Bank for Fundamentals of Statistics 6e 6th edition by Michael Sullivan. ISBN-13: 7022 Full Chapters test bank included 1. Data Collection 1.1 Introduction to the Practice of Statistics 1.2 Observational Studies versus Designed Experiments 1.3 Simple Random Sampling 1.4 Other Effective Sampling Methods 1.5 Bias in Sampling 1.6 The Design of Experiments Chapter 1 Review Chapter Test Making an Informed Decision: What College Should I Attend? II. DESCRIPTIVE STATISTICS 2....
-
Test Bank for Statistics: Informed Decisions Using Data, 6th Edition by Michael Sullivan
- Tentamen (uitwerkingen) • 502 pagina's • 2022
- €37,41
- 14x verkocht
- + meer info
Test Bank for Statistics: Informed Decisions Using Data 6e 6th Edition by Michael Sulliva. ISBN 0275, 6 Full chapters test bank PDF 1. Data Collection 1.1 Introduction to the Practice of Statistics 1.2 Observational Studies versus Designed Experiments 1.3 Simple Random Sampling 1.4 Other Effective Sampling Methods 1.5 Bias in Sampling 1.6 The Design of Experiments Chapter 1 Review Chapter Test Making an Informed Decision: What College Should I Attend? ...
-
MAT 202 EXAMINING RELATIONSHIPS CHECKPOINT 1 (Straighterline)
- Overig • 5 pagina's • 2023
- €18,46
- + meer info
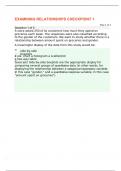
EXAMINING RELATIONSHIPS CHECKPOINT 1 Step 1 of 1 Question 1 of 5 A store asked 250 of its customers how much they spend on groceries each week. The responses were also classified according to the gender of the customers. We want to study whether there is a relationship between amount spent on groceries and gender. A meaningful display of the data from this study would be: side-by-side boxplots a pie chart a histogram a scatterplot a two-way table Good job! Side-by-side boxplots...


-
WGU C784-Statistics Mod 5 Exam Guide 2024
- Tentamen (uitwerkingen) • 10 pagina's • 2024
- €10,88
- + meer info
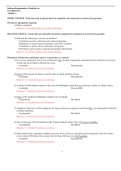
When one variable causes change in another, we call the first variable the ___________________ variable*. The affected variable is called the _______________ variable*. - When one variable causes change in another, we call the first variable the explanatory variable*. The affected variable is called the response variable*. In a randomized experiment, the researcher manipulates values of the explanatory variable and measures the resulting changes in the response variable. The differen...
-
WGU C784-STATISTICS MOD 5 |57 QUESTIONS AND ANSWERS
- Tentamen (uitwerkingen) • 13 pagina's • 2023
- €14,67
- + meer info
When one variable causes change in another, we call the first variable the ___________________ variable*. The affected variable is called the _______________ variable*. When one variable causes change in another, we call the first variable the explanatory variable*. The affected variable is called the response variable*. In a randomized experiment, the researcher manipulates values of the explanatory variable and measures the resulting changes in the response variable. The different va...
-
Uitgebreide samenvatting - Sociale Statistiek
- Samenvatting • 159 pagina's • 2023 Populair
- €5,49
- 2x verkocht
- + meer info
In dit document staat alles wat je moet weten om te slagen voor het theoretische gedeelte van het vak Sociale Statistiek.
-
WGU C955 Formulas and Terms (Latest 2023/ 2024 Update) Applied Probability and Statistics | Questions and Verified Answers| 100% Correct
- Tentamen (uitwerkingen) • 55 pagina's • 2023
- €10,88
- + meer info
WGU C955 Formulas and Terms (Latest 2023/ 2024 Update) Applied Probability and Statistics | Questions and Verified Answers| 100% Correct Q: Simpsons Paradox A counterintuitive situation that occurs when a result that appears in individual groups of data disappears or reverses when the groups are combined. Can only occur when the sizes of the groups are inconsistent Q: Lurking Variables : Answer: • A lurking variable is a variable not included in the study, but affects the varia...
-
WGU C784 - APPLIED HEALTHCARE STATISTICS EXAM TEST QUESTIONS
- Tentamen (uitwerkingen) • 32 pagina's • 2024
- €14,20
- + meer info
WGU C784 - APPLIED HEALTHCARE STATISTICS EXAM TEST QUESTIONS When one variable causes change in another, we call the first variable the ___________________ variable*. The affected variable is called the _______________ variable*. - CORRECT ANSWER-When one variable causes change in another, we call the first variable the explanatory variable*. The affected variable is called the response variable*. In a randomized experiment, the researcher manipulates values of the explanatory var...
