Quartiles Samenvattingen, Aantekeningen en Examens
Op zoek naar een samenvatting over Quartiles? Op deze pagina vind je 405 samenvattingen over Quartiles.
Pagina 3 van de 405 resultaten
Sorteer op
-
MATH 112 Shape of the Distribution
- Overig • 22 pagina's • 2023
- €21,34
- + meer info
Department of Mathematics and Natural Sciences Shape of the Distribution 1/1 Measures of Shape Skewness measures the deviation from the symmetry. SK = 3(µ median) (1) SK = 3(¯x median) s (2) Example The scores of the students in the Prelim Exam has a median of 18 and a mean of 16. What does this indicate about the shape of the distribution of the scores? Math031 - Mathematics in the Modern World 2 Boxplot A boxplot is also called a box - and - whisker plot. It is a graphical...

-
WPC 300 FINAL EXAM| 100 Questions| With Complete Solutions
- Tentamen (uitwerkingen) • 11 pagina's • 2023
- €9,95
- + meer info
Which of the following describes the standard deviation? correct answer: It is the square root of the variance. When two variables are highly positively correlated, the correlation coefficient will be _______. correct answer: close to 1 According to statistical notation, what does ∑ stand for? correct answer: to act as a summation operator The ________ is the observation that occurs most frequently. correct answer: mode The difference between the first and third quartiles is re...
-
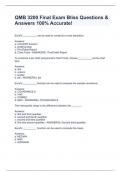
QMB 3200 Final Exam Bliss Questions & Answers 100% Accurate!
- Tentamen (uitwerkingen) • 27 pagina's • 2024
- €14,22
- + meer info
Excel's __________ can be used to construct a cross tabulation. Answers: a. COUNTIF function b. SUM function c. PivotTable Report d. Chart Tools - ANSWERSC. PivotTable Report To construct a pie chart using Excel's Chart Tools, choose __________ as the chart type. Answers: a. line b. column c. scatter d. pie - ANSWERSd. pie Excel's __________ function can be used to compute the sample covariance. Answers: a. COVARIANCE.S b. VAR c. CORREL d. MAX - ANSWERSa. COVARIA...
-
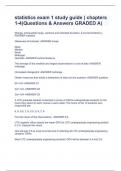
statistics exam 1 study guide ( chapters 1-4)Questions & Answers GRADED A)
- Tentamen (uitwerkingen) • 18 pagina's • 2023
- €11,38
- + meer info
(Range, interquartile range, variance and standard deviation, Z-scores/Outliners) -ANSWER variation (Skewness & Kurtosis) -ANSWER shape Mean Median Mode Midrange Quartiles -ANSWER central tendency The average of the smallest and largest observations in a set of data -ANSWER midrange (Xsmallest+Xlargest)/2 -ANSWER midrange Obtain measures that divide a distribution or data set into quarters -ANSWER quartiles (N+1)/4 -ANSWER Q1 2(n+1)/4 -ANSWER Q2 3(n+1)/4 -ANSWER Q3 ...
-
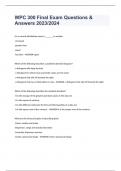
WPC 300 Final Exam Questions & Answers 2023/2024
- Tentamen (uitwerkingen) • 67 pagina's • 2023
- €14,22
- + meer info
WPC 300 Final Exam Questions & Answers 2023/2024 For a normal distribution mean is _______ to median. -not equal -greater than -equal -less than - ANSWER-equal Which of the following describes a positively skewed histogram? -a histogram with large kurtosis -a histogram for which mean and mode values are the same. -a histogram that tails off towards the right -a histogram that has no fluctuation in mass - ANSWER--a histogram that tails off towards the right Which of the followi...

Terwijl je dit leest heeft een medestudent weer €4,35 verdiend

-
Review Final Exam for WPC 300 2024/2025 questions with A-graded answers
- Tentamen (uitwerkingen) • 8 pagina's • 2024
- €12,32
- + meer info
Review Final Exam for WPC 300 2024/2025 questions with A-graded answers Which of the following describes the standard deviation? - CORRECT ANSWER-It is the square root of the variance. When two variables are highly positively correlated, the correlation coefficient will be _______. - CORRECT ANSWER-close to 1 According to statistical notation, what does ∑ stand for? - CORRECT ANSWER-to act as a summation operator The ________ is the observation that occurs most frequently. - CORR...
-
QMB 3200 Actual Exam with Questions and Answers|100% Solution
- Tentamen (uitwerkingen) • 10 pagina's • 2024
- €11,38
- + meer info
The standard deviation of a point estimator is the - standard error Cluster sampling is - a probability sampling method The interquartile range is the difference between the - first and third quartiles A __________ can be used to graphically present quantitative data. - both a histogram and a stem-and-leaf display are correct
-
GED Math Study Guide Practice Exam 2024
- Tentamen (uitwerkingen) • 16 pagina's • 2024
- €9,95
- + meer info
GED Math Study Guide Practice Exam 2024 Box plot - ANSWER a way of graphically depicting groups of numerical data through their quartiles Consecutive - ANSWER one following the other, for example, 19 and 20 are consecutive numbers Data - ANSWER a collection of facts, such as numbers, words, measurements, observations or even just descriptions of things Dot plot - ANSWER a graphical display of data using dots Event - ANSWER a set of possible outcomes resulting from a particular exper...
-
UCF QMB 3200 Final Exam Verified Questions with Correct Answers Graded A+
- Tentamen (uitwerkingen) • 7 pagina's • 2024
- €9,49
- + meer info
UCF QMB 3200 Final Exam Verified Questions with Correct Answers Graded A+ Categorical Data Uses categories with specified characteristics. Ratio Data are continuous and have a natural zero point. Most business and economic data, such as dollars and time, fall into this category. Age, length of residency/time. Ordinal Data Can be ordered or ranked according to some relationship. Examples: Overall Satisfaction, Quality of Schools, Sport Rankings. Interval Data Interval data are ordinal but...
-
AP Stat - Chapters 1-4 - Multiple Choice - Cumulative Test 2023/2024 already passed
- Tentamen (uitwerkingen) • 10 pagina's • 2023
- €17,07
- + meer info
AP Stat - Chapters 1-4 - Multiple Choice - Cumulative Testthe following histogram represents the distribution of acceptance rates (% accepted) among 25 business schools in 1997, what % of schools have an acceptance rate above 40% - correct answer know how to read a histogram (variable vs. freq, fraction -> %) you want to use numerical summaries to describe a distribution that is strongly skewed to the left, which combination of measure of center and spread would be the best to use (mean an...
