Interquartile Samenvattingen, Aantekeningen en Examens
Op zoek naar een samenvatting over Interquartile? Op deze pagina vind je 742 samenvattingen over Interquartile.
Pagina 3 van de 742 resultaten
Sorteer op
-
QMB 3200 Final Exam Bliss Questions and Answers 100% accurate!!!
- Tentamen (uitwerkingen) • 27 pagina's • 2024
- €11,51
- + meer info
QMB 3200 Final Exam Bliss Q Excel's __________ can be used to construct a cross tabulation. Answers: a. COUNTIF function b. SUM function c. PivotTable Report d. Chart Tools - ANSWERSC. PivotTable Report To construct a pie chart using Excel's Chart Tools, choose __________ as the chart type. Answers: a. line b. column c. scatter d. pie - ANSWERSd. pie Excel's __________ function can be used to compute the sample covariance. Answers: a. COVARIANCE.S b. VAR c. CORRE...
-
WGU D204 Questions And Answers Already Graded A+
- Tentamen (uitwerkingen) • 15 pagina's • 2023
- €8,15
- + meer info
Which activity does an analyst perform in the discovery phase of the data analytics life cycle? a. Collecting Data b. Cleaning Data c. Identifying outliers d. Identifying business needs - Answer Identifying business needs In which phase of the data analytics life cycle does an analyst build a histogram? a. Data acquisition b. Data exploration c. Discovery d. Predictive modeling - Answer Data Exploration An analyst applies a statistical formula to obtain the average temperature for a ci...
-
WGU D204 Pre Assessment Questions and Answers
- Tentamen (uitwerkingen) • 18 pagina's • 2024
- €14,87
- + meer info
1. Which activity does an analyst perform in the discovery phase of the data analytics life cycle?: Identifying business needs 2. In which phase of the data analytics life cycle does an analyst build a histogram?: Data exploration 3. An analyst applies a statistical formula to obtain the average temperature for a city over the last 50 years. Which phase of the data analytics life cycle is represented by this activity: Exploratory data analysis 4. An analyst has been tasked with defining da...

-
MATH 112 Shape of the Distribution
- Overig • 22 pagina's • 2023
- €21,59
- + meer info
Department of Mathematics and Natural Sciences Shape of the Distribution 1/1 Measures of Shape Skewness measures the deviation from the symmetry. SK = 3(µ median) (1) SK = 3(¯x median) s (2) Example The scores of the students in the Prelim Exam has a median of 18 and a mean of 16. What does this indicate about the shape of the distribution of the scores? Math031 - Mathematics in the Modern World 2 Boxplot A boxplot is also called a box - and - whisker plot. It is a graphical...
-
WGU D204 Practice Exam Questions and Answers Latest Updated 2024/2025 Scored A+
- Tentamen (uitwerkingen) • 16 pagina's • 2024
- €13,91
- + meer info
WGU D204 Practice Exam Questions and Answers Latest Updated 2024/2025 Scored A+. Identifying business needs Which activity does an analyst perform in the discovery phase of the data analytics life cycle? a. Collecting Data b. Cleaning Data c. Identifying outliers d. Identifying business needs Data Exploration In which phase of the data analytics life cycle does an analyst build a histogram? a. Data acquisition b. Data exploration c. Discovery d. Predictive modeling Exploratory data a...

Wil jij je uitgaves terugverdienen?


-
WGU D204 Pre Assessment Questions and Answers
- Tentamen (uitwerkingen) • 18 pagina's • 2024
- €15,83
- + meer info
1. Which activity does an analyst perform in the discovery phase of the data analytics life cycle?: Identifying business needs 2. In which phase of the data analytics life cycle does an analyst build a histogram?: Data exploration 3. An analyst applies a statistical formula to obtain the average temperature for a city over the last 50 years. Which phase of the data analytics life cycle is represented by this activity: Exploratory data analysis 4. An analyst has been tasked with defining da...

-
WPC 300 FINAL EXAM| 100 Questions| With Complete Solutions
- Tentamen (uitwerkingen) • 11 pagina's • 2023
- €10,07
- + meer info
Which of the following describes the standard deviation? correct answer: It is the square root of the variance. When two variables are highly positively correlated, the correlation coefficient will be _______. correct answer: close to 1 According to statistical notation, what does ∑ stand for? correct answer: to act as a summation operator The ________ is the observation that occurs most frequently. correct answer: mode The difference between the first and third quartiles is re...
-
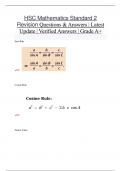
HSC Mathematics Standard 2 Revision Questions & Answers | Latest Update | Verified Answers | Grade A+
- Tentamen (uitwerkingen) • 14 pagina's • 2024
- €11,03
- + meer info
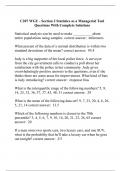
Sine Rule :: Cosine Rule :: Future Value :: the amount of money in the future that an amount of money today will yield, given prevailing interest rates Trapezoidal rule :: Limit of reading :: smallest unit on the measuring instrument also known as precision. Absolute error :: ½ × limit of reading (maximum value) Interquartile Range (IQR) :: the difference between the first quartile and third quartile. Q3 - Q1 standard deviation :: a measure of the spread of data about the m...

-
AQA AS BIOLOGY 7401/2 Paper 2 Mark scheme June 2022 .
- Tentamen (uitwerkingen) • 13 pagina's • 2022
- €9,59
- 1x verkocht
- + meer info
AQA AS BIOLOGY 7401/2 Paper 2 Mark scheme June 2022 . MARK SCHEME – AS BIOLOGY – 7401/2 – JUNE 2022 3 Mark scheme instructions to examiners 1. General The mark scheme for each question shows: • the marks available for each part of the question • the total marks available for the question • the typical answer or answers which are expected • Extra information to help the examiner make his or her judgement and help to delineate what is acceptable or not worthy of credit or, i...
-
C207 WGU - Section 2 Statistics as a Managerial Tool Questions With Complete Solutions
- Tentamen (uitwerkingen) • 13 pagina's • 2023
- €11,51
- + meer info
Statistical analysis can be used to make __________ about entire populations using samples. correct answer: inferences What percent of the data of a normal distribution is within two standard deviations of the mean? correct answer: 95.4 Judy is a big supporter of her local police force. A surveyor from the city government calls to conduct a poll about her satisfaction with the police in her community. Judy gives overwhelmingly positive answers to the questions, even if she thinks there a...
