Rta diagram Samenvattingen, Aantekeningen en Examens
Op zoek naar een samenvatting over Rta diagram? Op deze pagina vind je 3 samenvattingen over Rta diagram.
Alle 3 resultaten
Sorteer op
-
BRS/Pretest- Renal, vasc, resp, repro(Complete)2022
- Tentamen (uitwerkingen) • 27 pagina's • 2022
- €17,32
- + meer info
1. Secretion of K+ by the distal tubule will be decreased by (A) metabolic alkalosis (B) a high-K+ diet (C) hyperaldosteronism (D) spironolactone administration (E) thiazide diuretic administration The answer is D Distal K+secretion is decreased by factors that decrease the driving force for passive diffusion of K+ across the luminal membrane. Because spironolactone is an aldosterone antagonist, it reduces K+ secretion. Alkalosis, a diet high in K+, and hyperaldosteronism all incr...
-
Samenvatting Algemene Economie 2 (ALEC2) - Nyenrode Business Universiteit 2020
- Samenvatting • 27 pagina's • 2020
- €4,99
- 20x verkocht
- + meer info
Samenvatting voor het vak Algemene Economie 2 (ALEC 2) van Nyenrode Business Universiteit 2020. Samenvatting omvat de hoofdstukken 4, 5, 6, 7, 8, 11, 13, 16, 17, 18, 19 uit het boek 'The economics of European integration' van Baldwin & Wyplosz, de hoofdstukken 1.8, 17.1, 17.8, 17.10 t/m 17.13, 18.5, 18.6, 19 en 20 van The Core, de powerpoints en screencasts.
-
STAT 200: Introduction to Statistics Homework #4 Solutions Complete A+ Guide(Download to score an A)
- Tentamen (uitwerkingen) • 28 pagina's • 2021
- €13,47
- + meer info
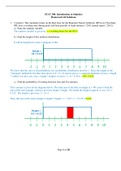
STAT 200: Introduction to Statistics Homework #4 Solutions 1. (3 points): The commuter trains on the Red Line for the Regional Transit Authority (RTA) in Cleveland, OH, have a waiting time during p eak rush hour periods of eight minutes ("2012 annual report," 2012). a.) State the random variable. The random variable is given by: x = waiting times for the RTA b.) Find the height of this uniform distribution. It will be beneficial to draw a diagram of this: We know that the sum of all probab...

Terwijl je dit leest heeft een medestudent weer €4,35 verdiend

