Dplyr Samenvattingen, Aantekeningen en Examens
Op zoek naar een samenvatting over Dplyr? Op deze pagina vind je 8 samenvattingen over Dplyr.
Alle 8 resultaten
Sorteer op
 Populair
-
Summary INFOMDWR Data Wrangling and Data Analysis 2022/2023
- Samenvatting • 78 pagina's • 2023
- €7,74
- 5x verkocht
- + meer info
This summary contains all the theory provided in the INFOMDWR course in 2022/2023. This includes elaborate description and practical examples of the concepts. This will help you preparing for the exam!
-
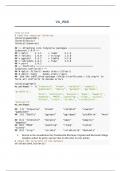
Using_our_Tools_VisualAnalytics_Week8_NEC_Solved
- Tentamen (uitwerkingen) • 10 pagina's • 2023
- €9,92
- 1x verkocht
- + meer info
1. Return to the visualization for Presidential Elections: Popular and Electoral College margins, subset by party, and use that to add color to your points. 2. Recreate figures 5.28 using functions from the dplyr library. 3. Using gss_sm data, calculate the mean and median number of children by degree 4. Using gapminder data, create a boxplot of life expectancy over time 5. Using gapminder data, create a violin plot of population over time
-
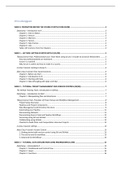
Summary Data Preparation and Workflow Management (dPrep) 2022/2023 - All Lectures, Readings, Tutorials
- Samenvatting • 38 pagina's • 2022
- €10,49
- 3x verkocht
- + meer info
Summary of all the readings, lectures, and tutorials (incl. answers) for the course Data Preparation and Workflow Management (dPrep). Not in a bullet-list type of way so you have to figure everything out yourself, but in clear, concise language. This file is a must-have for the open-book exam of this course: this file contains everything!
-
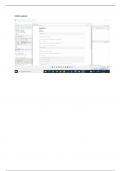
Week 3
- Samenvatting • 2 pagina's • 2023
- €9,92
- + meer info
The text is Mastering Spark with R. After installing the dplyr library, use the following code in R studio, create a scatter plot of hp v. mpg cars2 <- copy_to(sc, mtcars) cars3 <- (cars2) cars4 <- select(cars3, hp, mpg) cars5 <- sample_n(cars4, 32) cars6 <- collect(cars5) plot(cars6)
-
Georgia Tech ISYE - 6501 Homework 2 Due Date: Thursday, September 3rd, 2020, Graded A+
- Tentamen (uitwerkingen) • 9 pagina's • 2023
- €8,03
- + meer info
Georgia Tech ISYE - 6501 Homework 2 Due Date: Thursday, September 3rd, 2020, Graded A+ Document Content and Description Below ISYE - 6501 Homework 2 Due Date: Thursday, September 3rd, 2020 Contents 1 ISYE - 6501 Homework 2 2 2 Homework Analysis 2 2.1 Analysis 3.1 . . . . . . . . . . . . . . . . . . . . . . . . . . . . . . . . . . . . . . . . . . . . . . 2 2.2 Analysis 4.1 . . . . . . . . . . . . . . . . . . . . . . . . . . . . . . . . . . . . . . . . . . . . . . 7 2.3 Analysis 4.2 . . . . . . ...


-
R Programming Study Set With Questions and answers 100% verified
- Tentamen (uitwerkingen) • 68 pagina's • 2024
- €15,12
- + meer info
R Programming Study Set With Questions and answers 100% verified What is a factor? - ANSWER - The term factor refers to a statistical data type used to store categorical variables. How do you install packages in R? - ANSWER - install("package") - e.g. install(tidyverse) What is dplyr? - ANSWER - dplyr is a data management function in tidyverse package What is Hmisc? - ANSWER - Hmisc is documentation for statistical summary in R. What is R? - ANSWER - R is a powerful statistic...
-
Introduction to Programming Course Commands Guide
- Samenvatting • 9 pagina's • 2023
- €16,49
- + meer info
This document contains a guide on the R studio commands and what the command is used for to create and work with mathematical operations, readline variables, character variables, conditional statements, loops, functions, arrays and vectors, data frames, merges, and all of the dplyr commands.
-
Week 6 Homework, Questions with accurate answers, Graded A+
- Tentamen (uitwerkingen) • 11 pagina's • 2023
- €7,55
- + meer info
Week 6 Homework, Questions with accurate answers, Graded A+ Document Content and Description Below Week 6 Homework Question 9.1 Using the same crime data set as in Question 8.2, apply Principal Component Analysis and then create a regression model using the first few principal components. Specif y your new model in terms of the original variables (not the principal components), and compare its quality to that of your solution to Question 8.2. You can use the R function prcomp for PCA. Note tha...
