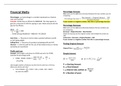
1 – 7 SMA (you should know this)
1. Basic mathematics
Differentiation, integration
Exponential functions
Function evaluation
Making plots of plynomial, rational and exponential functions
2. Descriptive statistics
Measurement level
Measures of central tendency (mean / mode / median)
o Where the mean doesn’t make sense, the variance and SD also don’t make sense.
Measures of dispersion
o From variance (σ 2) to standard deviation (σ ) use √ σ 2
Data visualization
o Bar chart shows just the observed values
o Histogram uses all values in between as well
3. Basic probability theory
Frequency, probability
The AND rule, NOT rule and OR rule
o Dependency If you know one variable, you can say something about the other
variable.
o Independency One variable does not influence the other. You cannot say anything
about the 2nd variable knowing something about the 1st variable.
Combinations and permutations
4. Binomial experiments & Sampling theory
Binomial experiments
o Binomial distribution
5. Sampling theory
The normal distribution
var X
o Var( X ) =
N
The distribution of sample means
o Averages have a normal distribution.
o Mean sample mean = population mean = μ
o Variance of sample means
o The bigger the sample, the closer it will get to the mean
Confidence intervals of the mean
o Critical values low probability (< 5%) of being of the sample population
o H0 and H1 (Null and alternative hypotheses)
, o ∝ = 5%
o Z-distribution
Z ( μ , σ 2)
6. Basic statistical analysis / statistical inference
Descriptive VS inferential
Statistical hypothesis testing
o Small sample cannot say whether or not a die f.e. is ‘unfair’
o Binomial experiment add up probabilities (Pr. x3 f.e.) when order does not matter
o The outcome shows the probability of the given happening if the die was fair
Reject when P < 5% / < 0,05
7. Statistical independence
Rationales of statistical testing
1. Postulate a population model (keyword: ‘null hypothesis’)
2. Compute the probability that your sample comes from that population (keyword: ‘p-
value’)
3. Reject the model if that probability is small 5% or < (keyword: ‘significance level’)
Probabilistic theory
Pearson’s Chi Square Test
o Contingency table
o Independence you can predict based on this independence
o Difference between what we expect and what we observe X2
o If X2 <0,05 we reject the H0 hypothesis that the two variables are independent
They are dependent
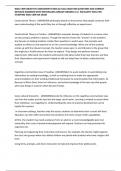
NEW RM2:
8. The two-sample (student) t-test
Compares the sample means of two samples (m1 and m2)
o Sample means differ
o When is the difference so big that they could not come from the same population?
… Assuming that the samples come from the same distribution (with mean μ)
o H0 : m1 = m2 = μ
o If H0 is true the distribution will be
m1−m2
t=
var ( m1−m2 )
… And that therefore ……….
9. Simple regression and correlation
Dependent, independent variable
R-square, F test
t statistics for coefficients (constant, beta)
Standardized beta
Correlation as linear regression
1. Basic mathematics
Differentiation, integration
Exponential functions
Function evaluation
Making plots of plynomial, rational and exponential functions
2. Descriptive statistics
Measurement level
Measures of central tendency (mean / mode / median)
o Where the mean doesn’t make sense, the variance and SD also don’t make sense.
Measures of dispersion
o From variance (σ 2) to standard deviation (σ ) use √ σ 2
Data visualization
o Bar chart shows just the observed values
o Histogram uses all values in between as well
3. Basic probability theory
Frequency, probability
The AND rule, NOT rule and OR rule
o Dependency If you know one variable, you can say something about the other
variable.
o Independency One variable does not influence the other. You cannot say anything
about the 2nd variable knowing something about the 1st variable.
Combinations and permutations
4. Binomial experiments & Sampling theory
Binomial experiments
o Binomial distribution
5. Sampling theory
The normal distribution
var X
o Var( X ) =
N
The distribution of sample means
o Averages have a normal distribution.
o Mean sample mean = population mean = μ
o Variance of sample means
o The bigger the sample, the closer it will get to the mean
Confidence intervals of the mean
o Critical values low probability (< 5%) of being of the sample population
o H0 and H1 (Null and alternative hypotheses)
, o ∝ = 5%
o Z-distribution
Z ( μ , σ 2)
6. Basic statistical analysis / statistical inference
Descriptive VS inferential
Statistical hypothesis testing
o Small sample cannot say whether or not a die f.e. is ‘unfair’
o Binomial experiment add up probabilities (Pr. x3 f.e.) when order does not matter
o The outcome shows the probability of the given happening if the die was fair
Reject when P < 5% / < 0,05
7. Statistical independence
Rationales of statistical testing
1. Postulate a population model (keyword: ‘null hypothesis’)
2. Compute the probability that your sample comes from that population (keyword: ‘p-
value’)
3. Reject the model if that probability is small 5% or < (keyword: ‘significance level’)
Probabilistic theory
Pearson’s Chi Square Test
o Contingency table
o Independence you can predict based on this independence
o Difference between what we expect and what we observe X2
o If X2 <0,05 we reject the H0 hypothesis that the two variables are independent
They are dependent
NEW RM2:
8. The two-sample (student) t-test
Compares the sample means of two samples (m1 and m2)
o Sample means differ
o When is the difference so big that they could not come from the same population?
… Assuming that the samples come from the same distribution (with mean μ)
o H0 : m1 = m2 = μ
o If H0 is true the distribution will be
m1−m2
t=
var ( m1−m2 )
… And that therefore ……….
9. Simple regression and correlation
Dependent, independent variable
R-square, F test
t statistics for coefficients (constant, beta)
Standardized beta
Correlation as linear regression