Overig
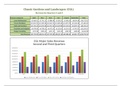
You also build a pie chart sheet to graph the proportion that each category contributes to total revenue. [Student Learning Outcomes 3.1, 3.2, 3.3, 3.4, 3.5, 3.6]
- Vak
- Instelling
You also build a pie chart sheet to graph the proportion that each category contributes to total revenue. [Student Learning Outcomes 3.1, 3.2, 3.3, 3.4, 3.5, 3.6] File Needed: ClassicG (Available from the Start File link.) Completed Project File Name: [your name]-ClassicG SKILLS COVERED...
[Meer zien]