Alle 2 resultaten
Sorteer op
Meest verkochte samenvattingen voor The Secret to Capitalizing on Analytics
-
Web_Analytics_Week10_Creating_a_dashboard
- Tentamen (uitwerkingen) • 5 pagina's • 2024 Populair
- €9,99
- + meer info
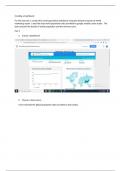
Creating a dashboard Part I: Log into the Google Analytics Demo Account () Create a dashboard. Choose a data source. Customize the report to bring forward the most relevant results. Take a screenshot for each question and provide a brief explanation of your experience completing the question. Part II: Log into the Answer the following questions by taking a screenshot and explaining what is being represented. Identify the terms driving the most organic traffic. Identify the terms lead...
-
Web_Analytics_Week14_Navigation_and_Advertisement_Reports
- Tentamen (uitwerkingen) • 9 pagina's • 2024 Populair
- €9,99
- + meer info
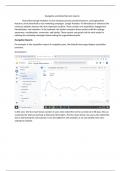
Navigation and Advertisement Reports Two of the newest features of GA 4.0 includes navigation and advertisement reports. After reading through the chapter, test out these two reports. Provide 3 screenshots per report (6 total). Below each screenshot, provide a 1-2 paragraph summary on what the image/report is highlighting. In addition, provide a sentence on how this is beneficial to web analysts. Note: This document is for learning purposes only.
Nieuwste samenvattingen van The Secret to Capitalizing on Analytics
-
Web_Analytics_Week14_Navigation_and_Advertisement_Reports
- Tentamen (uitwerkingen) • 9 pagina's • 2024 Nieuw
- €9,99
- + meer info
Navigation and Advertisement Reports Two of the newest features of GA 4.0 includes navigation and advertisement reports. After reading through the chapter, test out these two reports. Provide 3 screenshots per report (6 total). Below each screenshot, provide a 1-2 paragraph summary on what the image/report is highlighting. In addition, provide a sentence on how this is beneficial to web analysts. Note: This document is for learning purposes only.
-
Web_Analytics_Week10_Creating_a_dashboard
- Tentamen (uitwerkingen) • 5 pagina's • 2024 Nieuw
- €9,99
- + meer info
Creating a dashboard Part I: Log into the Google Analytics Demo Account () Create a dashboard. Choose a data source. Customize the report to bring forward the most relevant results. Take a screenshot for each question and provide a brief explanation of your experience completing the question. Part II: Log into the Answer the following questions by taking a screenshot and explaining what is being represented. Identify the terms driving the most organic traffic. Identify the terms lead...
