Math 399n Study guides, Class notes & Summaries
Looking for the best study guides, study notes and summaries about Math 399n? On this page you'll find 348 study documents about Math 399n.
Page 3 out of 348 results
Sort by
-
MATH 399N WEEK 6 iLab, MATH 399N Applied Managerial Statistics- Chamberlain College of Nursing
- Exam (elaborations) • 4 pages • 2023
- $10.99
- + learn more
MATH 399N WEEK 6 iLab, MATH 399N Applied Managerial Statistics- Chamberlain College of Nursing

-
MATH 399N WEEK 6 iLab, MATH 399N: Applied Managerial Statistics- Chamberlain
- Exam (elaborations) • 4 pages • 2023
- $7.99
- + learn more
MATH 399N WEEK 6 iLab, MATH 399N: Applied Managerial Statistics- Chamberlain
-
MATH 399N Week 7 Assignment; Course Project, Part II; Hypothesis Testing
- Other • 6 pages • 2023
- $29.49
- + learn more
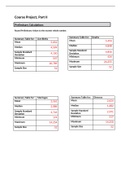
MATH 399N Week 7 Assignment; Course Project, Part II; Hypothesis Testing Course Project Topic: Compare CIs of two mean scores
-
MATH 399N Week 6 Assignment; Course Project Part I; Confidence Intervals
- Other • 9 pages • 2023
- $29.49
- + learn more
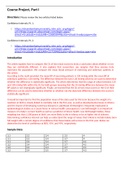
Course Project, Part I Directions: Please review the two articles listed below. Confidence Intervals, Pt. 1: • url= Confidence Intervals, Pt. 2: • Introduction The article explains how to compare the CIs of two mean scores to draw a conclusion about whether or not they are statistically different. It also explains that researchers use samples that they assume truly represent the population. We compare the mean blood pressure of exercising and sedentary patients in this articl...
-
MATH 399N Week 7 Assignment; Course Project Part II; Hypothesis Testing - Claims about total births, deaths, marriages and divorces
- Other • 6 pages • 2023
- $35.49
- + learn more
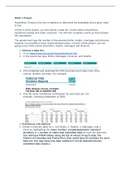
MATH 399N Week 7 Assignment; Course Project Part II; Hypothesis Testing In Part II of this project, you will choose a data set, review claims and perform hypothesis testing and make a decision. You will then complete a write-up that includes the calculations. The government logs the number of documented births, deaths, marriages and divorces however it is possible to have undocumented cases. In part II of this project, you are going to test claims about total births, deaths, marriages and di...


-
MATH399N Statistics Week 4 Lab/ MATH 399N Statistics Week 4 Lab (New 2021): Chamberlain College of Nursing
- Exam (elaborations) • 5 pages • 2021
- $14.49
- + learn more
MATH399N Statistics Week 4 Lab/ MATH 399N Statistics Week 4 Lab (New 2021): Chamberlain College of Nursing
-
MATH 399N Week 3 Quiz Questions and Answers- Chamberlain College of Nursing
- Exam (elaborations) • 6 pages • 2023
- $10.99
- + learn more
MATH 399N Week 3 Quiz Questions and Answers- Chamberlain College of Nursing
-
MATH 399N Week 6 Assignment; Course Project Part 1; Confidence Intervals
- Other • 5 pages • 2023
- $35.48
- + learn more
MATH 399N Week 6 Assignment; Course Project Part 1; Confidence Intervals
-
MATH 399N Week 7 Discussion; Rejection Region
- Other • 3 pages • 2023
- $20.49
- + learn more
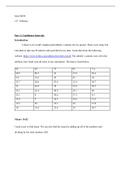
Initial Post Instructions After reviewing data from a sample, an inference can be made about the population. For example, Find a data set on the internet. Some suggested search terms: Free Data Sets, Medical Data Sets, Education Data Sets. 1. Introduce your Data Set and Cite the Source. 2. What trends do you notice in your data set? 3. Based on the trends and the history of your data set, make a claim. What kind of test (left, right, two tailed) would you have to complete? 4. Explain the st...
-
MATH 399N Week 2 Discussion; Misleading Graphs
- Other • 3 pages • 2023
- $20.49
- + learn more
Initial Post Instructions After exploring different types of graphs this week, it is unfortunate to learn that there are sometimes misleading graphs used in the news, politics, medicine, etc. in order to sway a decision or belief. Some items to watch out for in graphs area. 1. Is there a title that explains what the graph is displaying? 2. Are numbers on the axis spaced out proportionally or have they been varied to create a dramatic impression? 3. Is the graph too loud? Does it have too man...
