Math 1280 self quiz Study guides, Class notes & Summaries
Looking for the best study guides, study notes and summaries about Math 1280 self quiz? On this page you'll find 22 study documents about Math 1280 self quiz.
Page 2 out of 22 results
Sort by

-
MATH 1280 Self-Quiz Unit 3 (100%) | MATH1280 Self-Quiz Unit 3 (100%) – 2020
- Exam (elaborations) • 14 pages • 2021
- $13.99
- + learn more
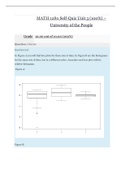
MATH 1280 Self-Quiz Unit 3 (100%) – University of the People Grade 10.00 out of 10.00 (100%) Question 1 Correct Question text In Figure A you will find box plots for three sets of data. In Figure B are the histograms for the same sets of data, but in a different order. Associate each box plot with its relative histogram. Figure A: Figure B: Box plot 1 Answer 1 Box plot 2 Answer 2 Box plot 3 Answer 3 Feedback Question 2 Correct Question text Consider the b...
-
MATH 1280 Self-Quiz Unit 7 (100%) |MATH1280 Self-Quiz Unit 7 (100%) – University of the People ( Download to Score A+)
- Exam (elaborations) • 7 pages • 2021
- $15.49
- + learn more
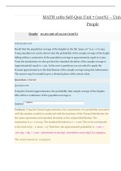
MATH 1280 Self-Quiz Unit 7 (100%) – University of the People Grade 10.00 out of 10.00 (100%) Information text Recall that the population average of the heights in the file "" is μ = 170.035. Using simulation it can be shown that the probability of the sample average of the height falling within 2 centimeter of the population average is approximately equal to 0.925. From the simulations we also got that the standard deviation of the sample average is (approximately) equal to 1.122. In the...
-
MATH 1280 Self - Quiz Unit 2– University of the People| MATH1280 Self - Quiz Version 2– ( Graded A)
- Exam (elaborations) • 13 pages • 2021
- $11.99
- + learn more
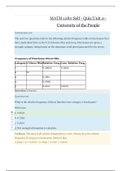
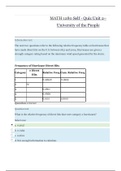
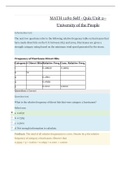
MATH 1280 Self - Quiz Unit 2– University of the People Information text The next two questions refer to the following relative frequency table on hurricanes that have made direct hits on the U.S. between 1851 and 2004. Hurricanes are given a strength category rating based on the minimum wind speed generated by the storm. Frequency of Hurricane Direct Hits Category # Direct Hits Relative Freq. Cum. Relative Freq. 1 0.39930 0.3993 2 72 3 0.2601 4 0.0659 5 0.0110 1.0000 Question 1 Co...
-
MATH 1280 Self - Quiz Module 2 MATH1280 Self - Quiz Unit 2– University of the People| – University of the People( A Grade)
- Exam (elaborations) • 9 pages • 2021
- $11.99
- + learn more
MATH 1280 Self - Quiz Unit 2– University of the People Information text The next two questions refer to the following relative frequency table on hurricanes that have made direct hits on the U.S. between 1851 and 2004. Hurricanes are given a strength category rating based on the minimum wind speed generated by the storm. Frequency of Hurricane Direct Hits Category # Direct Hits Relative Freq. Cum. Relative Freq. 1 0.39930 0.3993 2 72 3 0.2601 4 0.0659 5 0.0110 1.0...

-
MATH 1280 Self-Quiz Unit 3 (100%) – University of the People | MATH1280 Self-Quiz Unit 3 (100%) with Rationale
- Exam (elaborations) • 16 pages • 2020
- $8.99
- + learn more
MATH 1280 Self-Quiz Unit 3 (100%) – University of the People Grade 10.00 out of 10.00 (100%) Top of Form Question 1 Correct Question text In Figure A you will find box plots for three sets of data. In Figure B are the histograms for the same sets of data, but in a different order. Associate each box plot with its relative histogram. Figure A: Figure B: Box plot 1 Answer 1 Box plot 2 Answer 2 Box plot 3 Answer 3 Feedback Question 2 Correct Question text Consider the box plots in Figure A. W...

Too much month left at the end of the money?

-
MATH 1280 Self-Quiz Unit 3 (100%) –Harvard University
- Exam (elaborations) • 14 pages • 2021
- $13.49
- + learn more
Question text In Figure A you will find box plots for three sets of data. In Figure B are the histograms for the same sets of data, but in a different order. Associate each box plot with its relative histogram
-
MATH 1280 Self - Quiz Unit 2 – Harvard University
- Exam (elaborations) • 13 pages • 2021
- $14.49
- + learn more
What is the relative frequency of direct hits that were category 2 hurricanes? Select one: a. 0.2637 b. 0.7363 c. 0.2601 d. Not enough information to calculate.
-
Math 1280 self-test quiz for the Introduction to Statistics practice questions and answers solved solution
- Exam (elaborations) • 5 pages • 2021
- $14.49
- + learn more
Math 1280 self-test quiz for the Introduction to Statistics practice questions and answers solved solution
-
MATH 1280 Self-Quiz Unit 7 (100%) _ Harvard University
- Exam (elaborations) • 11 pages • 2021
- $14.49
- + learn more
Recall that the population average of the heights in the file "" is μ = 170.035. Using simulation it can be shown that the probability of the sample average of the height falling within 2 centimeter of the population average is approximately equal to 0.925. From the simulations we also got that the standard deviation of the sample average is (approximately) equal to 1.122. In the next 3 questions you are asked to apply the Normal approximation to the distribution of the sample avera...
-
MATH 1280 QUESTION WITH ANSWERS
- Exam (elaborations) • 19 pages • 2021
- $9.49
- + learn more
MATH 1280 Self-Quiz Unit 3 (100%) – In Figure A you will find box plots for three sets of data. In Figure B are the histograms for the same sets of data, but in a different order. Associate each box plot with its relative histogram. Figure A: Figure B: Box plot 1 Answer 1 Box plot 2 Answer 2 Box plot 3 Answer 3 Feedback Question 2 Correct Question text Consider the box plots in Figure A. Which of the data has a smaller inter-quartile range (IQR)? Figure A Select one:
