Boxplot Study guides, Class notes & Summaries
Looking for the best study guides, study notes and summaries about Boxplot? On this page you'll find 325 study documents about Boxplot.
Page 2 out of 325 results
Sort by
-
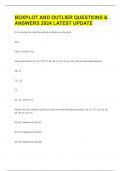
BOXPLOT AND OUTLIER QUESTIONS & ANSWERS 2024 LATEST UPDATE
- Exam (elaborations) • 4 pages • 2023
- $14.49
- + learn more
BOXPLOT AND OUTLIER QUESTIONS & ANSWERS 2024 LATEST UPDATE
-
MATH 112 Shape of the Distribution
- Other • 22 pages • 2023
- $22.49
- + learn more
Department of Mathematics and Natural Sciences Shape of the Distribution 1/1 Measures of Shape Skewness measures the deviation from the symmetry. SK = 3(µ median) (1) SK = 3(¯x median) s (2) Example The scores of the students in the Prelim Exam has a median of 18 and a mean of 16. What does this indicate about the shape of the distribution of the scores? Math031 - Mathematics in the Modern World 2 Boxplot A boxplot is also called a box - and - whisker plot. It is a graphical...
 Popular
-
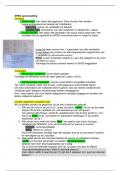
Samenvatting Statistiek 1 A (1e jaar psychologie RUG) - Introduction to the practice of Statistics (Moore & McCabe)
- Summary • 12 pages • 2024
- $6.55
- 4x sold
- + learn more
Samenvatting over de Hoofdstukken 1 t/m 5 van het boek Introduction to the practice of Statistics (Moore & McCabe 10e editie) In deze samenvatting word alle stof voor het tentamen van statistiek 1a behandeld voor 1e jaars studenten van Psychologie aan de Rijksuniversiteit Groningen. De samenvatting is geschreven op Goodnotes en bevat afbeeldingen ter toelichting van de formules/technieken.
-
WGU C955 Formulas and Terms (Latest 2023/ 2024 Update) Applied Probability and Statistics | Questions and Verified Answers| 100% Correct
- Exam (elaborations) • 55 pages • 2023
- $11.49
- + learn more
WGU C955 Formulas and Terms (Latest 2023/ 2024 Update) Applied Probability and Statistics | Questions and Verified Answers| 100% Correct Q: Simpsons Paradox A counterintuitive situation that occurs when a result that appears in individual groups of data disappears or reverses when the groups are combined. Can only occur when the sizes of the groups are inconsistent Q: Lurking Variables : Answer: • A lurking variable is a variable not included in the study, but affects the varia...
-
Samenvatting cursus SPSS
- Summary • 7 pages • 2023
- $4.97
- 1x sold
- + learn more
Deze samenvatting is bedoeld voor studenten die de opleiding Pedagogische Wetenschappen volgen aan Universiteit Leiden en in het 1e leerjaar zitten. Het bevat alle nodige informatie die gebruikt mag worden tijdens het tentamen.

Want to regain your expenses?

-
WGU C955 PROBABILITY AND STATISTICS
- Exam (elaborations) • 4 pages • 2023
- $10.49
- + learn more
Boxplot - Answer- an image that has min, Q1, median, Q3, max Histogram - Answer- A graphical representation -- bars, measuring the frequency within each interval Skewed right - Answer- Not a symmetric distribution, the tail is on the right, i.e. extra stuff on the right Measures of center - Answer- Median, the mean (and mode) Measures of spread - Answer- Range, IQR & standard deviation Standard Deviation Rule - Answer- 68% of the data are within 1 standard deviation,

-
Qlik Sense Business Analyst Certification Rated A+
- Exam (elaborations) • 8 pages • 2024
- $9.99
- + learn more
Qlik Sense Business Analyst Certification Rated A+ AA: Container Allows you to put multiple viz in a limited space and user can toggle through AA: Landing sheet you can select a sheet to be the landing page for your app, Create a bookmark and set it as default Advanced Authoring Advanced authoring are ways to customize sheets and how the space is used AGGR Used with other aggregate function (e.g. sum, max), API help automate tasks Attunity Aka Replicate, Gives ability to rep...
-
Green Packet MC Questions and Answers Already Passed
- Exam (elaborations) • 43 pages • 2024
- $11.49
- + learn more
Green Packet MC Questions and Answers Already Passed Of the following dotplots, which represents the set of data that has the greatest standard deviation? B split in half A random sample of 374 United States pennies was collected, and the age of each penny was determined. According to the boxplot below, what is the approximate interquartile range (IQR) of the ages? graph A 8 B 10 C 16 D 40 E 50 C 16 graph The histogram above shows the number of minute...

-
STAT 250 GMU EXAM 1 QUESTIONS AND ANSWERS 100% PASS
- Exam (elaborations) • 14 pages • 2024
- $9.99
- + learn more
STAT 250 GMU EXAM 1 QUESTIONS AND ANSWERS 100% PASS 2 main components of categorical distribution -Mode (typical/ most frequent outcome) -Variability (or diversity in outcomes) Appropriate graphs for Categorical data -Pie chart -Bar graph Appropriate graphs for Numerical data -Dotplot -Histogram -Stemplot Appropriate measures of center & spread for SKEWED distributions Center- Median Spread- Interquartile Range (The median is not affected by outliers and its value doess not ...
-
Probability and Statistics, WGU C955 Questions and Answers (Graded A)
- Exam (elaborations) • 4 pages • 2023
- $10.99
- + learn more
Probability and Statistics, WGU C955 Questions and Answers (Graded A) Probability and Statistics, WGU C955 Questions and Answers (Graded A) Probability and Statistics, WGU C955 Questions and Answers (Graded A)Boxplot - ANSWER-an image that has min, Q1, median, Q3, max Histogram - ANSWER-A graphical representation -- bars, measuring the frequency within each interval Skewed right - ANSWER-Not a symmetric distribution, the tail is on the right, i.e. extra stuff on the right Meas...
