
STAT 200 (STAT200)
University Of Maryland - Baltimore
Here are the best resources to pass STAT 200 (STAT200). Find STAT 200 (STAT200) study guides, notes, assignments, and much more.
Other
Stat 200 Midterm Exam
1.) A doctor wishes to estimate the mean triglyceride level of patients two hours after eating a steak dinner. To estimate the mean, you collect data from 22 patients. State the individual, variable, population, sample, parameter, and statistic. Individual: The triglyceride level of patients two hours after eating a steak dinner. Population: Total number of patients. Sample: The 22 patients. Parameter: Population mean. Statistic: Sample mean. 2.) Explain why the relative frequency column...
 Michael01
![STAT 200 WEEK 8 HOMEWORK [SOLVED > GRADE A]](/docpics/6138b84eb045c_1286907.jpg)
Exam (elaborations)
STAT 200 WEEK 8 HOMEWORK [SOLVED > GRADE A]
Question 1 (0.5 points) A team of cognitive psychologists studying the effects of sleep deprivation on short-term memory decay had eight participants stay in a sleep lab for two days. Four participants were randomly assigned to a condition in which they were not permitted to sleep during that period, while the other four participants were allowed to sleep when they wanted to. At the end of the two days, the participants completed a short-term memory task that yielded the results in the tabl...
Michael01
![STAT 200 Week 7 Homework Problems [SOLVED > GRADED A]](/docpics/6138b720dda7d_1286896.jpg)
Exam (elaborations)
STAT 200 Week 7 Homework Problems [SOLVED > GRADED A]
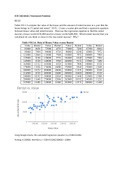
Table #10.1.6 contains the value of the house and the amount of rental income in a year that the house brings in (“Capital and rental,” 2013). Create a scatter plot and find a regression equation between house value and rental income. Then use the regression equation to find the rental income a house worth $230,000 and for a house worth $400,000. Which rental income that you calculated do you think is closer to the true rental income? Why? Table #10.1.6: Data of House Value versus Renta...
Michael01
Exam (elaborations)
STAT 200 Week 5 Homework - GRADE A
1. Why is a 99% confidence interval wider than a 95% confidence interval? 99% confidence interval is only slightly wider. In order to have a higher degree of confidence you need to include a larger proportion of the population. 2. A person claims to be able to predict the outcome of flipping a coin. This person is correct 16/25 times. Compute the 95% confidence interval on the proportion of times this person can predict coin flips correctly. What conclusion can you draw about this test of...
Michael01
Exam (elaborations)
STAT 200 Week 4 Homework - GRADED A
1. Assume the speed of vehicles along a stretch of I-10 has an approximately normal distribution with a mean of 71 mph and a standard deviation of 8 mph. a. The current speed limit is 65 mph. What is the proportion of vehicles less than or equal to the speed limit? 65−71 8 =−0.75 P = 22.66x100 = .2266 b. What proportion of the vehicles would be going less than 50 mph? 50−71 8 =−2.625 P = 0.x100 = .0043 c. A new speed limit will be initiated such that approximately 10% of veh...
Michael01
Exam (elaborations)
STAT 200 WEEK 2 Homework
Problem 9: Which of the box plots on the graph has a large positive skew? Which has a large negative skew? Box plot B has a large positive skew and box plot C has a large negative skew. Positive skews have a long tail going either right or up where a negative skew has a large tail going to the left or down. Problem 6: You recorded the time in seconds it took for 8 participants to solve a puzzle. These times appear below. However, when the data was entered into the statistical program, the...
Michael01
Exam (elaborations)
STAT 200 Week 2 Homework Problems
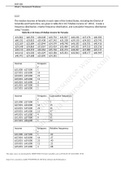
2.2.2 The median incomes of females in each state of the United States, including the District of Columbia and Puerto Rico, are given in table #2.2.10 ("Median income of," 2013). Create a frequency distribution, relative frequency distribution, and cumulative frequency distribution using 7 classes. Table #2.2.10: Data of Median Income for Females $31,862 $40,550 $36,048 $30,752 $41,817 $40,236 $47,476 $40,500 $60,332 $33,823 $35,438 $37,242 $31,238 $39,150 $34,023 $33,745 $33,269 $32,6...
Michael01
Exam (elaborations)
University of Maryland - STAT 200; Week 7 Homework Problems, Already Graded A
University of Maryland - STAT 200; Week 7 Homework Problems, Already Graded A
 karanjab
Exam (elaborations)
Stat 200 Week 1: Stat 200 Quiz 1 (Latest A Graded) Questions and Answers
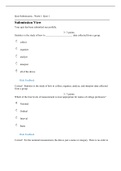
Quiz Submissions - Week 1: Quiz 1 Submission View Your quiz has been submitted successfully. Question 1 3 / 3 points Statistics is the study of how to ______________________ data collected from a group. collect organize analyze interpret all of the above Hide Feedback Correct! Statistics is the study of how to collect, organize, analyze, and interpret data collected from a group. Question 2 3 / 3 points Which of the four levels of measurement is most appro...
 TESTSOURCE
Exam (elaborations)
STAT 200 Week 3 Homework Problems.
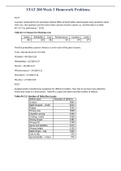
STAT 200 Week 3 Homework Problems 4.1.4 A project conducted by the Australian Federal Office of Road Safety asked people many questions about their cars. One question was the reason that a person chooses a given car, and that data is in table #4.1.4 ("Car preferences," 2013). Table #4.1.4: Reason for Choosing a Car Safety Reliability Cost Performance Comfort Looks 84 62 46 34 47 27 Find the probability a person chooses a car for each of the given reasons. 4.2.2 Eyeglassomatic manufactures eyeg...
 oassignment
Exam (elaborations)
STAT 200 Week 6 Homework Problems
STAT 200 Week 6 Homework Problems-Many high school students take the AP tests in different subject areas. In 2007, of the 144,796 students who took the biology exam 84,199 of them were female. In that same year, of the 211,693 students who took the calculus AB exam 102,598 of them were female ("AP exam scores," 2013). Estimate the difference in the proportion of female students taking the biology exam and female students taking the calculus AB exam using a 90% confidence level. n1=144,79...
 ProfMiaKennedy
Package deal
STAT 200- STAT 200 Week 1 Homework Problems (2). Questions and Answers
STAT 200- STAT 200 Week 1 Homework Problems (2). Questions and Answers
NelsonMwema
Package deal
STAT 200 FINAL EXAM 1,2 & FINAL EXAM ANSWER SHEET BUNDLE ( Latest Complete Solutions with shown working) Graded A
STAT 200 FINAL EXAM 1,2 & FINAL EXAM ANSWER SHEET BUNDLE ( Latest Complete Solutions with shown working) Graded A
ProfMiaKennedy
Exam (elaborations)
STAT 200 FINAL EXAM 2 ( Latest Complete Solutions with shown working) Graded A
STAT 200 FINAL EXAM 2 ( Latest Complete Solutions with shown working) Graded A/STAT 200 FINAL EXAM 2 ( Latest Complete Solutions with shown working) Graded A/STAT 200 FINAL EXAM 2 ( Latest Complete Solutions with shown working) Graded A/STAT 200 FINAL EXAM 2 ( Latest Complete Solutions with shown working) Graded A/STAT 200 FINAL EXAM 2 ( Latest Complete Solutions with shown working) Graded A/STAT 200 FINAL EXAM 2 ( Latest Complete Solutions with shown working) Graded A/STAT 200 FINAL EXAM 2 ( La...
ProfMiaKennedy
Exam (elaborations)
STAT 200 FINAL EXAM 1 ( Latest Complete Solutions with shown working) Graded A
STAT 200 FINAL EXAM 1 ( Latest Complete Solutions with shown working) Graded A>1.True or False. Justify for full credit. (a) If the variance of a data set is zero, then all the observations in this data set are zero. No, all the observations will be same but it is not necessary that all the observations will be zero, because if all the observations are same even then the variance will be zero. (b) If P(A) = 0.4 , P(B) = 0.5, and A and B are disjoint, then P(A AND B) = 0.9. ...
ProfMiaKennedy
Exam (elaborations)
STAT 200 - Homework 5 Solutions Question And Answers( Rated A)
Page 1 of 12 STAT 200: Introduction to Statistics Homework #5 Solutions 1. (3 points): Stephen Stigler determined in 1977 that the speed of light is 299,710.5 km/sec. In 1882, Albert Michelson had collected measurements on the speed of light ("Student t-distribution," 2013). Is there evidence to show that Michelson’s data is different from Stigler’s value of the speed of light? a.) State the random variable For this problem, the random variable will be: x = speed of light measured by Alber...
 Succeed
Exam (elaborations)
STAT 200 Stat 200 Week 6 Homework Question And Answers( Rated A)
STAT 200 Stat 200 Week 6 Homework Question And Answers 9.1.2 Many high school students take the AP tests in different subject areas. In 2007, of the 144,796 students who took the biology exam 84,1 99 of them were female. In that same year, of the 211,693 students who took the calculus AB exam 102,598 of them were female ("AP exam scores," 2013). Estimate the difference in the proportion of female students taking the biology exam and female students taking the calculus AB exam using a 90% confi...
Succeed
Exam (elaborations)
STAT 200 - Homework 5 Solutions Question And Answers( Download To Score A)
Page 1 of 12 STAT 200: Introduction to Statistics Homework #5 Solutions 1. (3 points): Stephen Stigler determined in 1977 that the speed of light is 299,710.5 km/sec. In 1882, Albert Michelson had collected measurements on the speed of light ("Student t-distribution," 2013). Is there evidence to show that Michelson’s data is different from Stigler’s value of the speed of light? a.) State the random variable For this problem, the random variable will be: x = speed of light measured by Alber...
Succeed
Exam (elaborations)
STAT 200 FINAL EXAM 1 QUESTION AND ANSWERS( DOWNLOAD TO SCORE), UNIVERSITY OF MARYLAND.
STAT200 FINAL EXAM STAT200 FINAL EXAM 1. True or False. Justify for full credit. (a) If the variance of a data set is zero, then all the observations in this data set are zero. (b) If P(A) = 0.4 , P(B ) = 0.5, and A and B are disjoint, then P(A AND B) = 0.9. (c) Assume X follows a continuous distribution which is symmetric about 0. If , then . (d) A 95% confidence interval is wider than a 90% confidence interval of the same parameter. (e) In a right-tailed test, the value of the test statistic i...
Succeed