Exam (elaborations)
STAT 200 Week 7 Homework Problems [SOLVED > GRADED A]
Rating
Sold
-
Pages
14
Grade
A+
Uploaded on
08-09-2021
Written in
2021/2022
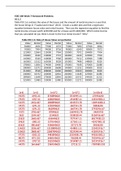
Table #10.1.6 contains the value of the house and the amount of rental income in a year that the house brings in (“Capital and rental,” 2013). Create a scatter plot and find a regression equation between house value and rental income. Then use the regression equation to find the rental income a house worth $230,000 and for a house worth $400,000. Which rental income that you calculated do you think is closer to the true rental income? Why? Table #10.1.6: Data of House Value versus Rental Value Rental Value Rental Value Rental Value Rental
Show more
Read less
Institution
University Of Maryland - Baltimore
Course
STAT 200 (STAT200)
Whoops! We can’t load your doc right now. Try again or contact support.
Written for
Document information
- Uploaded on
- September 8, 2021
- Number of pages
- 14
- Written in
- 2021/2022
- Type
- Exam (elaborations)
- Contains
- Questions & answers
Subjects
- stat 200 week 7 homework
- stat 200 homework week 7
- stat 200 week 7
- stat 200
- stat200
- stat200 week 7
- stat200 homework
-
stat 200 week 7 homework problems
-
table 1016 contains the value of the house and th
$9.99
Get access to the full document:
100% satisfaction guarantee
Immediately available after payment
Both online and in PDF
No strings attached
Also available in package deal
Package deal
STAT 200 WEEK 1,2,3,4,5,6,7,8, MIDTERM EXAM & FINAL EXAM SOLUTIONS. {GRADED A}
10
2021
$ 99.90
More info