STAT 200 Week 2 Homework Problems
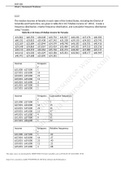
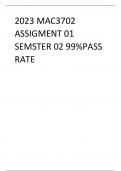
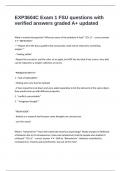
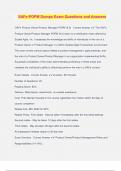
2.2.2 The median incomes of females in each state of the United States, including the District of Columbia and Puerto Rico, are given in table #2.2.10 ("Median income of," 2013). Create a frequency distribution, relative frequency distribution, and cumulative frequency distribution using 7 classes. Table #2.2.10: Data of Median Income for Females $31,862 $40,550 $36,048 $30,752 $41,817 $40,236 $47,476 $40,500 $60,332 $33,823 $35,438 $37,242 $31,238 $39,150 $34,023 $33,745 $33,269 $32,684 $31,844 $34,599 $48,748 $46,185 $36,931 $40,416 $29,548 $33,865 $31,067 $33,424 $35,484 $41,021 $47,155 $32,316 $42,113 $33,459 $32,462 $35,746 $31,274 $36,027 $37,089 $22,117 $41,412 $31,330 $31,329 $33,184 $35,301 $32,843 $38,177 $40,969 $40,993 $29,688 $35,890 $34,381 Income Frequenc y $21,000 - $27,000 1 $27,001 - $33,000 14 $33,001 - $39,000 21 $39,001 - $45,000 11 $45,001 - $51,000 4 $51,001 - $57,000 0 $57,001 - $63,000 1 Income Frequenc y Cumulative frequency $21,000 - $27,000 1 1 $27,001 - $33,000 14 15 $33,001 - $39,000 21 36 $39,001 - $45,000 11 47 $45,001 - $51,000 4 51 $51,001 - $57,000 0 51 $57,001 - $63,000 1 52 Income Frequenc y Relative frequency $21,000 - $27,000 1 .02 $27,001 - $33,000 14 .27 $33,001 - $39,000 21 .40 $39,001 - $45,000 11 .21 $45,001 - $51,000 4 .08 This study source was downloaded by from CourseH on :40:40 GMT -05:00 This study resource was shared via CourseH STAT 200 Week 2 Homework Problems $51,001 - $57,000 0 0 $57,001 - $63,000 1 .02 Total 52 1.00 2.2.6 Create a histogram and relative frequency histogram for the data in table #2.2.10. Describe the shape and any findings you can from the graph. Both graphs are skewed to the right. Which means more females in 2013 made lower median salaries rather than the higher median salaries
Written for
Document information
- Uploaded on
- September 8, 2021
- Number of pages
- 8
- Written in
- 2021/2022
- Type
- Exam (elaborations)
- Contains
- Questions & answers
Subjects
-
the median incomes of females in each state of the united states
-
including the district of columbia and puerto rico
-
are given in table 2210 median income of
-
2013 create a frequency dis
Also available in package deal