
STAT 200 (STAT200)
University Of Maryland - Baltimore
Here are the best resources to pass STAT 200 (STAT200). Find STAT 200 (STAT200) study guides, notes, assignments, and much more.
Package deal
SOPHIA INTRO TO STATS UNIT 1 MILESTONE 1 - UNIT 5 MILESTONE 5 BUNDLE
SOPHIA INTRO TO STATS UNIT 1 MILESTONE 1 - UNIT 5 MILESTONE 5 BUNDLE
 Bri254
Exam (elaborations)
Sophia Intro to Stats Unit 5 Milestone 5
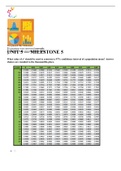
Sophia Intro to Stats Unit 5 Milestone 5.What value of z* should be used to construct a 97% confidence interval of a population mean? Answer choices are rounded to the thousandths place. 1.65 1.88 1.96 2.17 RATIONALE Using the z-chart to construct a 97% CI, this means that there is 1.5% for each tail. The lower tail would be at 0.015 and the upper tail would be at (1 - 0.015) or 0.985. The value of 0.9850 is actually on the z-table exactly. 0.9850 corresponds with a z-score of 2.17. CONCEPT Conf...
 Jumuja
Exam (elaborations)
Sophia Intro to Stats Unit 5 Milestone 5
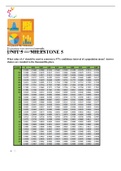
Sophia Intro to Stats Unit 5 Milestone 5.What value of z* should be used to construct a 97% confidence interval of a population mean? Answer choices are rounded to the thousandths place. 1.65 1.88 1.96 2.17 RATIONALE Using the z-chart to construct a 97% CI, this means that there is 1.5% for each tail. The lower tail would be at 0.015 and the upper tail would be at (1 - 0.015) or 0.985. The value of 0.9850 is actually on the z-table exactly. 0.9850 corresponds with a z-score of 2.17. CONCEPT Conf...
Bri254
Exam (elaborations)
Sophia Intro to Stats Unit 4 Milestone 4
Sophia Intro to Stats Unit 4 Milestone 4.For ten students, a teacher records the following scores of two assessments, Quiz 1 and Test. Quiz 1 (x) Test (y) 15 20 12 15 10 12 14 18 10 10 8 13 6 12 15 10 16 18 13 15 Mean 11.9 14.3 Standard Deviation 3.3 3.5 The correlation of Quiz 1 and Test is 0.568. Given the information below, what is the slope and y-intercept for the least-squares line of the Quiz 1 scores and Test scores? Answer choices are rounded to the hundredths place. Slope = 0.54 y-inter...
Jumuja
Exam (elaborations)
Sophia Intro to Stats Unit 4 Milestone 4
Sophia Intro to Stats Unit 4 Milestone 4.For ten students, a teacher records the following scores of two assessments, Quiz 1 and Test. Quiz 1 (x) Test (y) 15 20 12 15 10 12 14 18 10 10 8 13 6 12 15 10 16 18 13 15 Mean 11.9 14.3 Standard Deviation 3.3 3.5 The correlation of Quiz 1 and Test is 0.568. Given the information below, what is the slope and y-intercept for the least-squares line of the Quiz 1 scores and Test scores? Answer choices are rounded to the hundredths place. Slope = 0.54 y-inter...
Bri254
Exam (elaborations)
Sophia Intro to Stats Unit 3 Milestone 3
Sophia Intro to Stats Unit 3 Milestone 3.Which of the following is a property of binomial distributions? All of the observations made are dependent of each other. There are exactly four possible outcomes for each trial. The expected value is equal to the number of successes in the experiment. The variable of interest is the total number of successes or failures for a given number of observations. RATIONALE Recall that for the binomial distribution we are concerned with an event occurring (succes...
Jumuja
Exam (elaborations)
Sophia Intro to Stats Unit 3 Milestone 3
Sophia Intro to Stats Unit 3 Milestone 3.Which of the following is a property of binomial distributions? All of the observations made are dependent of each other. There are exactly four possible outcomes for each trial. The expected value is equal to the number of successes in the experiment. The variable of interest is the total number of successes or failures for a given number of observations. RATIONALE Recall that for the binomial distribution we are concerned with an event occurring (succes...
Bri254
Exam (elaborations)
Sophia Intro to Stats Unit 2 Milestone 2
Sophia Intro to Stats Unit 2 Milestone 2.In which of these cases should the median be used? When the data has small variance When data has no outliers When the data has extreme values When the data has nominal values RATIONALE Since the mean uses the actual values in the data, it is most affected by outliers and skewness. So, we only want to use the mean when the data is symmetric as a measure of centrality. When the data is skewed or has extreme values, the median is a better measure since it i...
Jumuja
Exam (elaborations)
Sophia Intro to Stats Unit 2 Milestone 2
Sophia Intro to Stats Unit 2 Milestone 2.In which of these cases should the median be used? When the data has small variance When data has no outliers When the data has extreme values When the data has nominal values RATIONALE Since the mean uses the actual values in the data, it is most affected by outliers and skewness. So, we only want to use the mean when the data is symmetric as a measure of centrality. When the data is skewed or has extreme values, the median is a better measure since it i...
Bri254
Exam (elaborations)
Sophia Intro to Stats Unit 1 Milestone 1
Sophia Intro to Stats Unit 1 Milestone 1.A hunter is practicing his aim using a practice target. He takes 5 shots. All 5 shots hit the target, but they do not hit or surround the bullseye. In addition, all 5 shots are very spread apart on the target. Classify the hunter's accuracy and precision. Low accuracy and low precision High accuracy and low precision Low accuracy and high precision High accuracy and high precision RATIONALE Since the arrows fall away from the bullseye and are spread out ...
Jumuja
Exam (elaborations)
Sophia Intro to Stats Unit 1 Milestone 1
Sophia Intro to Stats Unit 1 Milestone 1.A hunter is practicing his aim using a practice target. He takes 5 shots. All 5 shots hit the target, but they do not hit or surround the bullseye. In addition, all 5 shots are very spread apart on the target. Classify the hunter's accuracy and precision. Low accuracy and low precision High accuracy and low precision Low accuracy and high precision High accuracy and high precision RATIONALE Since the arrows fall away from the bullseye and are spread out ...
Bri254
Exam (elaborations)
STAT 200 WEEK 8 HOMEWORK – 9.6/10 – 96%
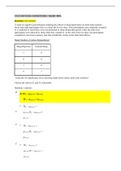
STAT 200 WEEK 8 HOMEWORK – 9.6/10 – 96% Question 1 (0.5 points) A team of cognitive psychologists studying the effects of sleep deprivation on short-term memory decay had eight participants stay in a sleep lab for two days. Four participants were randomly assigned to a condition in which they were not permitted to sleep during that period, while the other four participants were allowed to sleep when they wanted to. At the end of the two days, the participants completed a short-term memor...
 reviewnurse
Exam (elaborations)
STAT 200 SOLUTIONS MANUAL
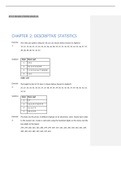
STAT 200 SOLUTIONS MANUAL CHAPTER 2: DESCRIPTIVE STATISTICS Exercise 1. The miles per gallon rating for 30 cars are shown below (lowest to highest). 19, 19, 19, 20, 21, 21, 25, 25, 25, 26, 26, 28, 29, 31, 31, 32, 32, 33, 34, 35, 36, 37, 37, 38, 38, 38, 38, 41, 43, 43 Solution Table 1.84 Exercise 2. Solution Exercise 3. The height in feet of 25 trees is shown below (lowest to highest). 25, 27, 33, 34, 34, 34, 35, 37, 37, 38, 39,...
reviewnurse
Exam (elaborations)
Varcarolis: Essentials of Psychiatric Mental Health Nursing: A Communication Approach to Evidence-Based Care, 4th Edition
1. Which outcome, focused on recovery, would be expected in the plan of care for a patient living in the community and diagnosed with serious and persistent mental illness? Within 3 months, the patient will demonstrate what behavior? a. Denying suicidal ideation b. Reporting a sense of well-being c. Taking medications as prescribed d. Attending clinic appointments on time ANS: B Recovery emphasizes managing symptoms, reducing psychosocial disability, and improving role performance....
 Havilah
Exam (elaborations)
STAT 200 Week 3 Study Guide – Practice Problems with Step-by-Step Solutions
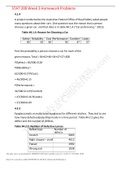
STAT 200 Week 3 Study Guide – Practice Problems with Step-by-Step Solutions 4.1.4 A project conducted by the Australian Federal Office of Road Safety asked people many questions about their cars. One question was the reason that a person chooses a given car, and that data is in table #4.1.4 ("Car preferences," 2013). Table #4.1.4: Reason for Choosing a Car Safety Reliability Cost Performance Comfort Looks 84 62 46 34 47 27 Find the probability a person chooses a car for each of the...
 paulhans
Exam (elaborations)
STAT 200 Week 5 Homework Problems
STAT 200 Week 5 Homework Problems 7.1.4 Stephen Stigler determined in 1977 that the speed of light is 299,710.5 km/sec. In 1882, Albert Michelson had collected measurements on the speed of light ("Student t-distribution," 2013). Is there evidence to show that Michelson’s data is different from Stigler’s value of the speed of light? State the random variable, population parameter, and hypotheses. Yes, Michelson’s data is different from Stigler’s value. Random variable: speed of light me...
Bri254
Exam (elaborations)
STAT 200 Week 2 Homework Problems
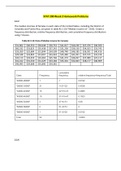
STAT 200 Week 2 Homework Problems 2.2.2 The median incomes of females in each state of the United States, including the District of Columbia and Puerto Rico, are given in table #2.2.10 ("Median income of," 2013). Create a frequency distribution, relative frequency distribution, and cumulative frequency distribution using 7 classes. Table #2.2.10: Data of Median Income for Females $31,862 $40,550 $36,048 $30,752 $41,817 $40,236 $47,476 $40,500 $60,332 $33,823 $35,438 $37,242 $31,238 $39,150 $34...
Bri254
Exam (elaborations)
STAT 200 Week 4 Homework Problems
STAT 200 Week 4 Homework Problems 6.1.2 ⦁ The commuter trains on the Red Line for the Regional Transit Authority (RTA) in Cleveland, OH, have a waiting time during peak rush hour periods of eight minutes ("2012 annual report," 2012). ⦁ State the random variable. X=The waiting time of the trains on the Red Line ⦁ Find the height of this uniform distribution. F(x)= 1/8-0 = 0.125 ⦁ Find the probability of waiting between four and five minutes. P(4<X<5)= (5-4)*0.125 = 0.125 ⦁ Find ...
Bri254
Package deal
STAT 200 WEEK 1,2,3,4,5,6,7,8, MIDTERM EXAM & FINAL EXAM SOLUTIONS. {GRADED A}
STAT 200 WEEK 1,2,3,4,5,6,7,8, MIDTERM EXAM & FINAL EXAM SOLUTIONS. {GRADED A}
Michael01
Exam (elaborations)
STAT 200 Final Examination > Answer Sheet
Record your answers and work. Problem Number Solution 1 Answer: (a) (ii) Density of people per square kilometer (b) (i) All countries in the world Justification for (a) and (b): (a): A variable is the measurement or observation of the individual(s). (b): The population is the set of values of the variable for the entire group of individuals. 2 Answer: (a) (ii) Nominal (b) (iii) Mode Justification for (a) and (b): (a): Since there are no numbers, no order to the data, and you cann...
Michael01