Boxplots Samenvattingen, Notities en Examens
Op zoek naar een samenvatting over Boxplots? Op deze pagina vind je 118 samenvattingen over Boxplots.
Pagina 4 van de 118 resultaten
Sorteer op
-
AP Statistics Exam Review 2023 with Complete Solutions
- Tentamen (uitwerkingen) • 19 pagina's • 2023
-
Ook in voordeelbundel
-
- €11,86
- + meer info
What is a dotplot? - ANSWER-A graphical display which shows "dots" for each point. It's good for categorical data- ie data classified into categories. What's the difference between categorical and quantitative data? - ANSWER-Categorical data fits into various categories; whereas, quantitative data has numerical values associated with it. What is a bar chart? - ANSWER-A display for categorical data which indicates frequencies or percents for each category. What are histograms? - ANSW...
-
C784 STATISTICS FULL COURSE REVIEW|37 QUESTIONS AND ANSWERS.
- Tentamen (uitwerkingen) • 7 pagina's • 2023
-
Ook in voordeelbundel
-
- €12,81
- + meer info
Lurking Variable Associated with the explanatory and the response variables that is not directly being studied. Simpson's Paradox Occurs when a trend or result that appears in groups of data disappears when we combine the data. Regression Analysis A process for estimating and analyzing the relationship between variables. Least-Squares Regression Line AKA the line of best fit. y = mx + b "rise over run" Interpolation Using existing data along with the Least-S...
-
C955 wrap before oa question with complete solution 2023 already passed
- Tentamen (uitwerkingen) • 8 pagina's • 2023
-
Ook in voordeelbundel
-
- €9,49
- + meer info
C955 wrap before oa question with complete solution 2023 already passedJust categorical - correct answer pie chart ( part of a whole ) or bar chart just quantitative - correct answer histogram ( for intervals) stem plot ( for exact values ) or boxplot or dot plot ( less common) categorical > categorical - correct answer contingency - (two way) table to create conditional percentages Quantitative > Quantitative - correct answer scatterplot and use correlation coefficient categor...
-
WGU C995 Exam Questions & Answers Accurate 100%
- Tentamen (uitwerkingen) • 10 pagina's • 2024
-
Ook in voordeelbundel
-
- €11,86
- + meer info
quantitative data - Answer Quantitative data consists of data values that are numbers, representing quantities that can be counted or measured. The Empirical Rule - Answer According to The Empirical Rule, approximately 68% of the data points in a dataset will be within 1 standard deviation of the mean. 95% of all values are within 2 standard deviations of the mean. Normal distribution - Answer In a normal distribution data is symmetrical, so the mean, median, and mode are all equal. mea...
-
C784 Statistics FULL COURSE REVIEW Complete Guide Study Questions And Answers Graded A+.
- Tentamen (uitwerkingen) • 7 pagina's • 2024
-
Ook in voordeelbundel
-
- €12,33
- + meer info
Lurking Variable - correct answer Associated with the explanatory and the response variables that is not directly being studied. Simpson's Paradox - correct answer Occurs when a trend or result that appears in groups of data disappears when we combine the data. Regression Analysis - correct answer A process for estimating and analyzing the relationsh...
-
WGU C784 Statistics FULL COURSE REVIEW Graded A+
- Tentamen (uitwerkingen) • 5 pagina's • 2023
-
- €10,91
- + meer info
Lurking Variable - Associated with the explanatory and the response variables that is not directly being studied. Simpson's Paradox - Occurs when a trend or result that appears in groups of data disappears when we combine the data. Regression Analysis - A process for estimating and analyzing the relationship between variables. Least-Squares Regression Line - AKA the line of best fit. y = mx + b "rise over run" Interpolation - Using existing data along with the Least-Squares Re...
-
College aantekeningen Kwantitatieve En Theoretische Biologie (B-B1KWBI20) The Analysis of Biological Data, ISBN: 9781319325343
- College aantekeningen • 14 pagina's • 2022
-
Ook in voordeelbundel
-
- €7,49
- 1x verkocht
- + meer info
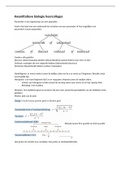
aantekeningen uit hoorcolleges over kwantitatieve biologie en alle belangrijke formules met uitleg uit de behandelde hoofdstukken
-
STAT 252 LAB 1 University of Alberta STAT 252 (Questions and Answers)
- Tentamen (uitwerkingen) • 11 pagina's • 2023
-
- €7,59
- + meer info
1. Comment on the study design. In particular, is this an observational study or experimental study? What kind of inference or interpretation can you make? Is it possible to establish a causal link between the speed limit increases and the change in interstate traffic fatalities using this data? What is the population of interest? Can the findings be generalized to this population? This is an observational study as the data has been collected from previous study and the researcher has had ...
-
Statistics Notes
- College aantekeningen • 16 pagina's • 2023 Populair
-
Ook in voordeelbundel
-
- €5,69
- 1x verkocht
- + meer info
Covers 9 chapters of Statistics content from the MATH 2020 course at NSU. goes into depth topics of probability, graphs, measure of center, binomial probability distribution, normal distribution, hypothesis and claim testing.
-
Business Analytics Chapter 3 All Answers Correct
- Tentamen (uitwerkingen) • 4 pagina's • 2024
-
Ook in voordeelbundel
-
- €9,01
- + meer info
Business Analytics Chapter 3 All Answers Correct graph for a quantitative variable ️histogram since there are no categories in a histogram, we usually slice up all of the possible values into_____ and then count the number of cases that fall in each of these ️bins like histograms, but they also give individual values ️stem-and leaf displays what are the 2 steps in making a stem-and-leaf display? ️1. use the first digit of a number (called the stem) to name the bins. The stem ...

Wist je dat een verkoper gemiddeld €76 per maand verdient met het verkopen van samenvattingen? Hint, hint. Ontdek alles over verdienen op Stuvia


