Boxplots Samenvattingen, Notities en Examens
Op zoek naar een samenvatting over Boxplots? Op deze pagina vind je 119 samenvattingen over Boxplots.
Pagina 2 van de 119 resultaten
Sorteer op

-
WGU C784 STATISTICS MOD 5 2024 QUESTIONS WITH CORRECT ANSWERS ALREADY PASSED AND VERIFIED
- Tentamen (uitwerkingen) • 17 pagina's • 2024
- €14,81
- + meer info
1. When one variable causes change in another, we call the first variable the variable*. The affected variable is called the variable*.: When one vari- able causes change in another, we call the first variable the explanatory variable*. The affected variable is called the response variable*. In a randomized experiment, the researcher manipulates values of the explanatory variable and measures the resulting changes in the response variable. The different values of the explanatory variable a...
-
MTB1 samenvatting blok5 kansrekening en beschrijvende statistiek - premaster gezondheidswetenschappen VU
- Samenvatting • 22 pagina's • 2023
- €5,89
- + meer info
De volgende onderwerpen verzameld uit het hoorcollege de werkgroep en aanvullende informatie komen aan bod; soorten variabelen, waarnemingen, centrale maten en spreidingsmaten, kansrekening en alle kansregels (uitleg+voorbeelden), boxplots, diagnostische kenmerken, sensitiviteit en specificiteit, positief voorspellende waarde

-
Samenvatting relevante artikelen tentamen Ruimtelijke data en geo-informatie
- Samenvatting • 15 pagina's • 2022
- €5,99
- 38x verkocht
- + meer info
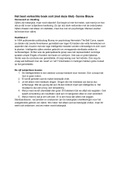
In dit document zijn de volgende artikelen samengevat, - De inleiding, hoofdstuk 2 en 4 van het boek, Het Best Verkochte Boek Ooit (met deze titel). - Baggerman, K. (2020). Migratieachtergrond? Volgens de Leefbaarometer maak jij je wijk dan slechter. - Deijl, S. (2012). De rechtvaardigheid van de Leefbaarometer. AGORA Magazine voor sociaalruimtelijke vraagstukken, 2012 (1) - Mak, A. (2012). Aandachtswijken: publiek sturen op waarde. AGORA Magazine voor sociaalruimtelijke vraagstukken, 2012...
-
WGU C784-Statistics Mod 5 Questions with Answers Rated A+
- Tentamen (uitwerkingen) • 15 pagina's • 2023
- €10,98
- + meer info
When one variable causes change in another, we call the first variable the ___________________ variable*. The affected variable is called the _______________ variable*. When one variable causes change in another, we call the first variable the explanatory variable*. The affected variable is called the response variable*. In a randomized experiment, the researcher manipulates values of the explanatory variable and measures the resulting changes in the response variable. The different va...
-
WGU C784 STATISTICS MOD 5 2024 QUESTIONS WITH CORRECT ANSWERS ALREADY PASSED AND VERIFIED
- Tentamen (uitwerkingen) • 17 pagina's • 2024
- €14,81
- + meer info
WGU C784 STATISTICS MOD 5 2024 QUESTIONS WITH CORRECT ANSWERS ALREADY PASSED AND VERIFIED 1. When one variable causes change in another, we call the first variable the variable*. The affected variable is called the variable*.: When one vari-able causes change in another, we call the first variable the explanatory variable*. The affected variable is called the response variable*. In a randomized experiment, the researcher manipulates values of the explanatoryvariable and measures the res...

Teveel maand over aan het eind van je geld?


-
WGU C784-Statistics Mod 5 Exam Questions and Answers 100% pass
- Tentamen (uitwerkingen) • 17 pagina's • 2024
- €11,94
- + meer info
WGU C784-Statistics Mod 5 Exam Questions and Answers 100% pass When one variable causes change in another, we call the first variable the ___________________ variable*. The affected variable is called the _______________ variable*. - Answer- When one variable causes change in another, we call the first variable the explanatory variable*. The affected variable is called the response variable*. In a randomized experiment, the researcher manipulates values of the explanatory variable and me...
-
LSS Final Exam Package Questions and Answers with Complete Solutions Graded A 2024
- Tentamen (uitwerkingen) • 47 pagina's • 2024
- €13,85
- + meer info
Which of the following tools are considered part of the seven quality control (7QC) tools. a) gage R & R b) flow charts c) Pareto charts d) control charts e) b, c and d f) all the above - e) flow charts, pareto charts and control charts True or False: A cause and effect diagram captures historical knowledge but does not focus on present knowledge. - False True or False: The check sheet is one of the seven quality control tools. - True Depending on the type of control chart used, w...
-
WGU C784-STATISTICS MOD 5 EXAM | QUESTIONS & 100% VERIFIEDANSWERS | LATEST UPDATE | PASSED
- Tentamen (uitwerkingen) • 22 pagina's • 2024
- €10,51
- + meer info
WGU C784-STATISTICS MOD 5 EXAM | QUESTIONS & 100% VERIFIEDANSWERS | LATEST UPDATE | PASSED When one variable causes change in another, we call the first variable the ___________________ variable*. The affected variable is called the _______________ variable*. Correct Answer: When one variable causes change in another, we call the first variable the explanatory variable*. The affected variable is called the response variable*. In a randomized experiment, the researcher manipulates...
-
Information_Visualization_Week5_NEC_Solved
- Tentamen (uitwerkingen) • 9 pagina's • 2023
- €9,55
- + meer info
Experiment with the gapminder data to practice some of the new geoms we have learned. Try examining population or life expectancy over time using a series of boxplots. (Hint: you may need to use the group aesthetic in the aes() call.) Can you facet this boxplot by continent? Is anything different if you create a tibble from gapminder that explicitly groups the data by year and continent first, and then create your plots with that? Comment your code line by line. Explain what your charts are show...
-
Stats 201 Exam 1 utk (Chapters 1-8)
- Tentamen (uitwerkingen) • 3 pagina's • 2023
- €9,55
- + meer info
categorial variable - Answer- any variable that can put in to groups. Examples include gender, class in school and color quantative variable - Answer- actual real numbers. This means if it is 2 it actually means 2 something. Examples include age, weight, and GPA. identifier variable - Answer- records a unique value for each case, used to name or identify it bar chart - Answer- A categorical univariate display of data that puts the counts in to bins that look like bars. The bars have no ...
