Boxplots Samenvattingen, Notities en Examens
Op zoek naar een samenvatting over Boxplots? Op deze pagina vind je 119 samenvattingen over Boxplots.
Pagina 3 van de 119 resultaten
Sorteer op
-
MATH 302: INTRODUCTION TO PROBABILITY FINAL EXAM 2022/2023(MAY-AUGUST QTR) 100% CORRECT AND VRIFIED ANSWERS FOR DISTINTION PASS (Highly RECOMMENDED)
- Tentamen (uitwerkingen) • 66 pagina's • 2023
- €14,33
- + meer info
Question 1 of 20 1.0/ 1.0 Points Which of the following statements are false regarding a boxplot? A. The height of the box has no significance. B. Boxplots can be used to either describe a single variable in a data set or to compare two (or more) variables C. The length of the box equals the range of the data. D. The right and left of the box are the third and first quartiles Answer Key: C Question 2 of 20 1.0/ 1.0 Points A histogram that has a single peak and looks approximatel...
-
WGU C784 STATISTICS MOD 5 2024 QUESTIONS WITH CORRECT ANSWERS ALREADY PASSED AND VERIFIED
- Tentamen (uitwerkingen) • 17 pagina's • 2024
- €14,80
- + meer info
WGU C784 STATISTICS MOD 5 2024 QUESTIONS WITH CORRECT ANSWERS ALREADY PASSED AND VERIFIED 1. When one variable causes change in another, we call the first variable the variable*. The affected variable is called the variable*.: When one vari-able causes change in another, we call the first variable the explanatory variable*. The affected variable is called the response variable*. In a randomized experiment, the researcher manipulates values of the explanatoryvariable and measures the res...
-
WGU C784 Statistics FULL COURSE REVIEW Graded A+
- Tentamen (uitwerkingen) • 5 pagina's • 2023
- €11,46
- + meer info
Lurking Variable - Associated with the explanatory and the response variables that is not directly being studied. Simpson's Paradox - Occurs when a trend or result that appears in groups of data disappears when we combine the data. Regression Analysis - A process for estimating and analyzing the relationship between variables. Least-Squares Regression Line - AKA the line of best fit. y = mx + b "rise over run" Interpolation - Using existing data along with the Least-Squares Re...
-
MATH 302: STATISTICS BEC1 FINAL EXAM 2022/2023(MAY-AUGUST QTR) 100% CORRECT AND VRIFIED ANSWERS FOR DISTINTION PASS (Highly RECOMMENDED)
- Tentamen (uitwerkingen) • 66 pagina's • 2023
- €13,37
- + meer info
Question 1 of 20 1.0/ 1.0 Points Which of the following statements are false regarding a boxplot? A. The height of the box has no significance. B. Boxplots can be used to either describe a single variable in a data set or to compare two (or more) variables C. The length of the box equals the range of the data. D. The right and left of the box are the third and first quartiles Answer Key: C Question 2 of 20 1.0/ 1.0 Points A histogram that has a single peak and looks approximatel...
-
Test Bank for Statistics: Concepts and Controversies, 10th Edition by David S. Moore
- Tentamen (uitwerkingen) • 372 pagina's • 2022
- €43,48
- 2x verkocht
- + meer info
Test Bank for Statistics: Concepts and Controversies, 10th Edition by David S. Moore, WIlliam I Notz Full chapters test bank in PDF ISBN-13: 9028 PART I Producing Data 1 Where Do Data Come From? Case Study: An Online Poll Talking about Data: Individuals and Variables Observational Studies Sample Surveys Census Experiments Chapter 1: Statistics in Summary Link It Case Study Evaluated Macmillan Learning Online Resources Check the Basics Chapter 1 Exercises 2 Samples, Good a...

Teveel maand over aan het eind van je geld?

-
Stat 311 Homework 3 – this homework uses the student performance data that was used in HW2 - ALL ANSWERS ARE CORRECT
- Tentamen (uitwerkingen) • 2 pagina's • 2023
- €7,64
- + meer info
Stat 311 Homework 3 – this homework uses the student performance data that was used in HW2 1 1. Some basic univariate visualization of the reading and math scores. In the HW3 template, we provide ggplot code to make histograms and boxplots of the Reading and Math variables (the Writing variable was explored in HW2). We use ggarrange from the ggpubr package (install the package first if you did not install it when playing with the demo code in Quantitative.Rmd) to put all four graphs in a...

-
C784 Statistics Full Course Review Questions and Answers
- Tentamen (uitwerkingen) • 5 pagina's • 2023
- €9,07
- + meer info
Lurking Variable - Associated with the explanatory and the response variables that is not directly being studied. Simpson's Paradox - Occurs when a trend or result that appears in groups of data disappears when we combine the data. Regression Analysis - A process for estimating and analyzing the relationship between variables. Least-Squares Regression Line - AKA the line of best fit. y = mx + b "rise over run" Interpolation - Using existing data along with the L...

-
Sophia Intro to Stats Unit 2 Milestone 2,
- Tentamen (uitwerkingen) • 20 pagina's • 2023
- €18,15
- + meer info
In which of these cases should the median be used? When the data has small variance When data has no outliers When the data has extreme values When the data has nominal values RATIONALE Since the mean uses the actual values in the data, it is most affected by outliers and skewness. So, we only want to use the mean when the data is symmetric as a measure of centrality. When the data is skewed or has extreme values, the median is a better measure since it is not as sensitive to the...
-
BUSINESS 1000 MAT 300 M2 Latest Verified Review 2023 Practice Questions and Answers for Exam Preparation, 100% Correct with Explanations, Highly Recommended, Download to Score A+
- Tentamen (uitwerkingen) • 18 pagina's • 2023
- €8,11
- + meer info
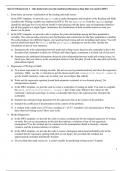
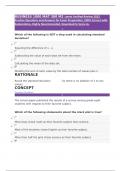
BUSINESS 1000 MAT 300 M2 Latest Verified Review 2023 Practice Questions and Answers for Exam Preparation, 100% Correct with Explanations, Highly Recommended, Download to Score A+ 1 Which of the following is NOT a step used in calculating standard deviation? • Squaring the difference of x - u. • Subtracting the value of each data set from the mean. • Calculating the mean of the data set. • Dividing the sum of each value by the total number of values plus 1. RATIONALE ...
-
Data Analysis with Microsoft Excel.
- Tentamen (uitwerkingen) • 613 pagina's • 2023
- €33,92
- + meer info
Data Analysis with Microsoft Excel. Introduction Data Analysis with Microsoft® Excel: Updated for Offi ce 2007® harnesses the power of Excel and transforms it into a tool for learning basic statistical analysis. Students learn statistics in the context of analyzing data. We feel that it is important for students to work with real data, analyzing real-world problems, so that they understand the subtleties and complexities of analysis that make statistics such an integral part of underst...
