Nataliedillon
On this page, you find all documents, package deals, and flashcards offered by seller nataliedillon.
- 67
- 0
- 1
Community
- Followers
- Following
68 items
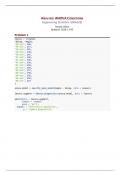
Statistics: ANOVA Conditions
Includes Rstudio code that imports data, creates an ANOVA model of the data, get the diagnostics for the data, plots the model, makes a conclusion
- Other
- • 2 pages •
Includes Rstudio code that imports data, creates an ANOVA model of the data, get the diagnostics for the data, plots the model, makes a conclusion
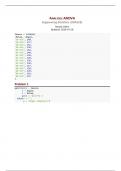
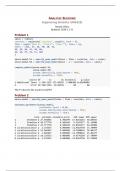
Statistics: ANOVA analysis
includes Rstudio code that imports data, plots the data, creates anova models for both hypotheses, compares anova models, calculates p-value and error , makes a conclusion
- Other
- • 2 pages •
includes Rstudio code that imports data, plots the data, creates anova models for both hypotheses, compares anova models, calculates p-value and error , makes a conclusion
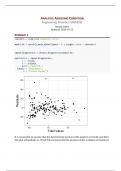
Statistics: Assessing Conditions
includes Rstudio code that reads data, creates a model, obtains diagnostics, creates a plot and makes a conclusion
- Other
- • 2 pages •
includes Rstudio code that reads data, creates a model, obtains diagnostics, creates a plot and makes a conclusion
Nonlinear Systems of Equations
solved homework problems. nonlinear systems of equations and Fourier problems.
- Other
- • 6 pages •
solved homework problems. nonlinear systems of equations and Fourier problems.
Statistics: Blocking Analysis
Includes rstudio code to import and analyze data, perform and anova analysis for different models, compare the models, estimate parameters, and make a conclusion
- Other
- • 2 pages •
Includes rstudio code to import and analyze data, perform and anova analysis for different models, compare the models, estimate parameters, and make a conclusion
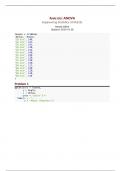
ANOVA Analysis
ANOVA analysis on Rstudio. Includes code to read and separate data, and create a plot. includes conclusions from plot
- Other
- • 2 pages •
ANOVA analysis on Rstudio. Includes code to read and separate data, and create a plot. includes conclusions from plot
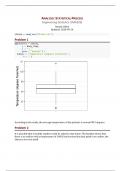
Analysis of the statistical process
Includes Rstudio code to import data, analyze data, create data plot, and make conclusion based on data.
- Other
- • 1 pages •
Includes Rstudio code to import data, analyze data, create data plot, and make conclusion based on data.
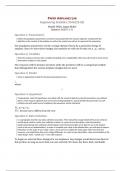
Statistical Analysis of Paper Airplanes
Question 1: Parameter(s) Define the population parameter(s) of interest associated with the research objective. Include both the definition in the context of the problem as well as the symbol you will use to represent this parameter. Our population parameters are the average distance flown by a particular design of airplane. Since we have three designs, the symbols we will use for this are μ_1,μ_2, and μ_3. Question 2: Variables State the response and any other variables (including un...
- Other
- • 6 pages •
Question 1: Parameter(s) Define the population parameter(s) of interest associated with the research objective. Include both the definition in the context of the problem as well as the symbol you will use to represent this parameter. Our population parameters are the average distance flown by a particular design of airplane. Since we have three designs, the symbols we will use for this are μ_1,μ_2, and μ_3. Question 2: Variables State the response and any other variables (including un...

Solving Systems of Equations
Solved homework problems: systems of equations, reduced row echelon form
- Other
- • 6 pages •
Solved homework problems: systems of equations, reduced row echelon form
Null Distributions
One of the most important steps in any statistical analysis is accounting for the variability in our estimate of the parameter of interest. Last week, we saw this through the lens of a sampling distribution. This week, we will see that if we want to find evidence against a hypothesis, we must determine the value of the statistic (or standardized statistic) we expect when the null hypothesis is true while accounting for the variability in our statistic. This leads to the null distribution. This a...
- Class notes
- • 4 pages •
One of the most important steps in any statistical analysis is accounting for the variability in our estimate of the parameter of interest. Last week, we saw this through the lens of a sampling distribution. This week, we will see that if we want to find evidence against a hypothesis, we must determine the value of the statistic (or standardized statistic) we expect when the null hypothesis is true while accounting for the variability in our statistic. This leads to the null distribution. This a...