Math 533 course project Study guides, Class notes & Summaries
Looking for the best study guides, study notes and summaries about Math 533 course project? On this page you'll find 88 study documents about Math 533 course project.
All 88 results
Sort by
-
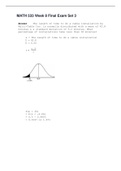
MATH 533 Course Project Part C Regression Model Keller 2023
- Exam (elaborations) • 18 pages • 2023
- $10.49
- + learn more
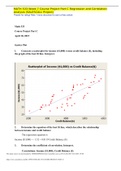
MATH 533 Course Project Part C Regression Model Keller 2023. The correlation coefficient between sales and calls is calculated as 0.871. This positive correlation coefficient tells us that as the number of calls increase so does the number of sales. Correlation: Sales, Calls (Appendix III) Minitab Result Pearson correlation of Sales and Calls = 0.871 P-Value = 0.000 4. Minitab Result: (See above Fitted Line Plot for below result) S = 2.05708 R-Sq = 75.9% R-Sq(adj) = 75.7% The coefficien...

-
Keller MATH 533 Course Project Part B, Hypothesis Testing
- Exam (elaborations) • 13 pages • 2023
- $10.49
- + learn more
Keller MATH 533 Course Project Part B, Hypothesis Testing. Hypotheses testing involves the testing of the null hypothesis and the alternative hypothesis. When testing the hypothesis either the null hypothesis or the alternative hypotheses is rejected. The value to a company knowing to accept or reject a hypothesis will aid in the decision making process. Information derived from hypothesis testing can aid in more timely decision. Requirement A: The average (mean) sales per week exceeds 41.5...
-
MATH 533: Applied Managerial Statistics Course Project –Part A 2023
- Exam (elaborations) • 9 pages • 2023
- $10.49
- + learn more
MATH 533: Applied Managerial Statistics Course Project –Part A 2023. SALESCALL Inc. is a company with thousands of salespeople. The data provided; SALES (the number of sales made this week), CALLS (the number of sales calls made this week), TIME (the average time per call this week), YEARS (years of experience in the call center) and TYPE (the type of training, either group training, online training of no training). The data is used to determine the most productive sales person. With this ...
-
MATH 533 Week 7 Course Project Part C Regression and Correlation Analysis (SALESCALL Project)
- Exam (elaborations) • 7 pages • 2022
- $23.49
- + learn more
MATH 533 Week 7 Course Project Part C Regression and Correlation Analysis (SALESCALL Project)
-
MATH-533 Week 2 Course Project, Part A – Exploratory Data Analysis- Graded An A+
- Other • 8 pages • 2024
- $13.99
- + learn more
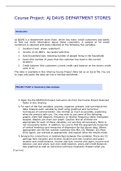
MATH-533 Week 2 Course Project, Part A – Exploratory Data Analysis- Graded An A+ Introduction This study will present a detailed statistical analysis of a given data set from a sam ple of credit customers in the department chain stores AJ Davis. The purpose of the study is to understand the customers in order for AJ Davis to expand their business The study will try to define the correlation between; income, years, and Credit Balance. For example: Is the longer the customer lives at that curren...

Too much month left at the end of the money?

-
MATH 533 Entire Course Week 1 – 8 BUNDLED | Documents To help pass in the exams | 100% correct solutions
- Package deal • 18 items • 2022
- $19.49
- + learn more
MATH 533 Week 1 Homework Problems MATH-533 Week 1 Discussion: Graphing Data On USA Immigration MATH 533 Week 1 Discussion: Study and Sample Design MATH-533 Week 1 Quiz – Solutions MATH 533 Week 2 Course Project Part A: Exploratory Data Analysis MATH-533 Week 2 Homework Problems MATH 533 Week 2 Textbook Homework Questions MATH-533 Week 2 Disc
-
MATH 533 Week 7 Course Project Part C: Regression and Correlation Analysis | Already GRADED A+
- Other • 15 pages • 2022
- $10.99
- + learn more
MATH 533 Week 7 Course Project Part C: Regression and Correlation Analysis | Already GRADED A+

-
MATH 533 Week 7 Course Project Part C Regression and Correlation Analysis
- Exam (elaborations) • 15 pages • 2022
- $12.99
- + learn more
Running Head: Course Project Part C Regression Model MATH – 533 - 60846 Ans .1 Minitab Result Regression Analysis: Sales versus Calls Math 2 The regression equation is Sales = 9.638 + 0.2018 Calls 120 130 140 150 160 170 180 190 200 210 55 50 45 40 35 30 S 2.05708 R-Sq 75.9% R-Sq(adj) 75.7% Calls Sales Fitted LinePlot Sales= 9.638 + 0.2018 Calls It is evident with the help of scatter graph trend line that there is positive relationship between Sales and calls. If numbe...
-
(300+ QUESTIONS AND ANSWERS)UPDATED HESI A2 MATHS 2 VERSIONS 2023-2024 REAL EXAM
- Exam (elaborations) • 73 pages • 2023
- $8.99
- + learn more
HESI A2 MATHS 2 LATEST VERSIONS REAL EXAM 300+ QUESTIONS AND ANSWERS VERSION A 1. Convert 5 3/4 to a decimal. Round to the nearest tenth. A. 5.75 B. 5.7 C. 5.8 D. 6 2. A warehouse worker ships 25 boxes each day. Every box contains 3 shipping labels. Inventory has 500 shipping labels. How many days will it take to use the inventory of shipping labels? Round to the nearest whole. A. 7 days B. 8 days C. 20 days D. 6 days 3. Ratio and proportion. 6:10::24:x A. 40 B. 25 C. 240 D...
-
MATH 533 COURSE PROJECT PART A, B, C (AJ DAVIS STORE)
- Exam (elaborations) • 20 pages • 2023
- $27.49
- + learn more
MATH 533 COURSE PROJECT PART A, B, C (AJ DAVIS STORE)
