Stem and leaf plot Study guides, Class notes & Summaries
Looking for the best study guides, study notes and summaries about Stem and leaf plot? On this page you'll find 399 study documents about Stem and leaf plot.
Page 4 out of 399 results
Sort by
-
MATH302 Week 2 Test
- Exam (elaborations) • 19 pages • 2023
- $34.99
- + learn more
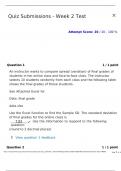
1. Question: An instructor wants to compare spread (variation) of final grades of students in her online class and face-to-face class. The instructor selects 10 students randomly from each class and the following table shows the final grades of those students. See Attached Excel for Data. 2. Question: The lengths (in kilometers) of rivers on the South Island of New Zealand that flow to the Tasman Sea are listed below. Find the variance. See Attached Excel for Data. Use the Excel function to fin...
-
MAT 232 Midterm Exam Questions With Correct Answers Latest Updated 2024 (GRADED)
- Exam (elaborations) • 27 pages • 2024
- $15.49
- + learn more
MAT 232 Midterm Exam Questions With Correct Answers Latest Updated 2024 (GRADED) What is a sample statistic, what is a population parameter, and what is the difference between them? What is a sample statistic? A. A sample statistic is a range of likely values that a population parameter could take. B. A sample statistic is a numerical value describing some attribute of a population. C. A sample statistic is a numerical value describing some attribute of a sample. This is the correct answer ...

-
MATH302 Week 2 Test Questions and Answers APU
- Exam (elaborations) • 19 pages • 2024
- $29.99
- + learn more
1. Question: An instructor wants to compare spread (variation) of final grades of students in her online class and face-to-face class. The instructor selects 10 students randomly from each class and the following table shows the final grades of those students. See Attached Excel for Data. 2. Question: The lengths (in kilometers) of rivers on the South Island of New Zealand that flow to the Tasman Sea are listed below. Find the variance. See Attached Excel for Data. Use the Excel function to fin...

-
MATH302 Week 2 Test
- Exam (elaborations) • 19 pages • 2023
- $22.49
- + learn more
1. Question: An instructor wants to compare spread (variation) of final grades of students in her online class and face-to-face class. The instructor selects 10 students randomly from each class and the following table shows the final grades of those students. See Attached Excel for Data. 2. Question: The lengths (in kilometers) of rivers on the South Island of New Zealand that flow to the Tasman Sea are listed below. Find the variance. See Attached Excel for Data. Use the Excel function to fin...
-
Middle School Mathematics (Praxis II Exam) - Probability, Statistics, and Discrete Mathematics
- Exam (elaborations) • 3 pages • 2024
- $9.99
- + learn more
Middle School Mathematics (Praxis II Exam) - Probability, Statistics, and Discrete Mathematics Tables A convenient way to present data clearly. The data is presented in two columns, with the item being measured in one column and the number (or percentage) of data points for that item in another column. Quantitative Data Data having to do with quantities as the items being measured. Categorical Data Data having to do with the categories as the items being measured. Bar Graphs Convey infor...


-
MATH302 Week 2 Test
- Exam (elaborations) • 19 pages • 2023
- $28.49
- + learn more
1. Question: An instructor wants to compare spread (variation) of final grades of students in her online class and face-to-face class. The instructor selects 10 students randomly from each class and the following table shows the final grades of those students. See Attached Excel for Data. 2. Question: The lengths (in kilometers) of rivers on the South Island of New Zealand that flow to the Tasman Sea are listed below. Find the variance. See Attached Excel for Data. Use the Excel function to fin...
-
Statistics final wgu academy exam questions and answers
- Exam (elaborations) • 7 pages • 2024
- $11.49
- + learn more
Statistics final wgu academy exam questions and answers Categorical variables that there is no natural order among the categories - Answer- nominal variables Categorical variables where there is natural order among the categories (low-high) - Answer- ordinal variable A measurement which makes sense to talk about the difference between values but not the ratio between values - Answer- interval Quantitive variables where is makes sense to talk about the difference in ratios. (Income, weig...
-
C784 MODULE 4 DESCRIPTIVE STATISTICS FOR A SINGLE VARIABLE |56 QUESTIONS WITH VERIFIED CORRECT ANSWERRS
- Exam (elaborations) • 9 pages • 2023
- $14.49
- + learn more
qualitative data Non-numeric information based on some quality or characteristic. Categorical data, also called qualitative data, consists of data that are groups, such as names or labels, and are not necessarily numerical. You use what type of charts for Categorical Data Pie charts-percents Bar Charts-display frequencies or counts for categorical data What type of charts do you use for Quantitative Data Dot plots-shows each data value as a point, arranged in order along a h...

-
Statistics final wgu academy exam questions and answers
- Exam (elaborations) • 7 pages • 2024
- $11.49
- + learn more
Statistics final wgu academy exam questions and answers Categorical variables that there is no natural order among the categories - Answer- nominal variables Categorical variables where there is natural order among the categories (low-high) - Answer- ordinal variable A measurement which makes sense to talk about the difference between values but not the ratio between values - Answer- interval Quantitive variables where is makes sense to talk about the difference in ratios. (Income, weig...

-
MATH302 Week 2 Test
- Exam (elaborations) • 19 pages • 2023
- $29.49
- + learn more
1. Question: An instructor wants to compare spread (variation) of final grades of students in her online class and face-to-face class. The instructor selects 10 students randomly from each class and the following table shows the final grades of those students. See Attached Excel for Data. 2. Question: The lengths (in kilometers) of rivers on the South Island of New Zealand that flow to the Tasman Sea are listed below. Find the variance. See Attached Excel for Data. Use the Excel function to fin...
