Sophia statistics final milestone Study guides, Class notes & Summaries
Looking for the best study guides, study notes and summaries about Sophia statistics final milestone? On this page you'll find 161 study documents about Sophia statistics final milestone.
Page 4 out of 161 results
Sort by
-
Sophia Statistics Final Milestone Questions & A grade Answers | SOLVED 100%
- Exam (elaborations) • 19 pages • 2021
- $10.99
- + learn more
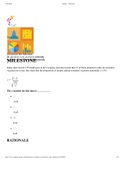
Sophia Statistics Final Milestone Qestions & A grade Answers>Sukie interviewed 125 employees at her company and discovered that 21 of them planned to take an extended vacation next year. She finds that the proportion of people taking extended vacations nationally is 15%.The z statistic for this data is .-0.560.450.560.45RATIONALETo make things a little easier, let's first note the denominator We can now note thatinally, subbing all in we findCONCEPTZ-Test for Population Proportions 2Jesse...
-
Statistics Unit 5 Milestone Course Hero rated A download to score A
- Exam (elaborations) • 22 pages • 2022
- $7.99
- + learn more
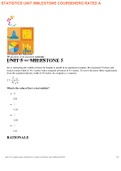
Statistics Unit 5 Milestone Course Hero rated A download to score ASTATISTIC UNIT 5 MILESTONE COURSE HERO 6/29/2020 Sophia :: Welcome If we first note the denominator of Then, getting the z-score we can note it is This tells us that 36.1 is 2.83 standard deviations above the value of 36. Note that when you round some values you may get slightly different results, but the results should be relatively close to this final calculated value. CONCEPT Z-Test for Population Means 2 Emile has calculated ...

-
Sophia Statistics Final Milestone..pdf
- Exam (elaborations) • 24 pages • 2023
- $13.99
- + learn more
Sophia Statistics Final Milestone..pdf
-
Sophia Statistics Final Milestone
- Study guide • 21 pages • 2020
- $10.49
- 22x sold
- + learn more
Sophia Statistics Final Milestone
-
Sophia Statistics Final Milestone
- Exam (elaborations) • 21 pages • 2021
- $10.99
- + learn more
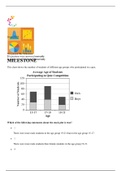
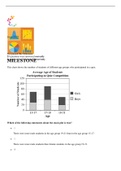
Sophia Statistics Final Milestone This chart shows the number of students of different age groups who participated in a quiz. Which of the following statements about the stack plot is true? There were more male students in the age group 19-21 than in the age group 15-17. There were more male students than female students in the age group 19-21. There were more female students in the age group 17-19 than in any other age group. There were more students in the age group 15-17 than in any other age...

And that's how you make extra money


-
Sophia Statistics Final Milestone...pdf
- Exam (elaborations) • 22 pages • 2023
- $13.99
- + learn more
Sophia Statistics Final Milestone...pdf

-
Sophia Statistics Final Milestone..pdf
- Exam (elaborations) • 24 pages • 2023
- $14.48
- + learn more
Sophia Statistics Final Milestone..pdf
-
Sophia Statistics Final Milestone...pdf
- Exam (elaborations) • 22 pages • 2023
- $14.48
- + learn more
Sophia Statistics Final Milestone...pdf

-
Sophia Statistics Final Milestone,..pdf
- Exam (elaborations) • 20 pages • 2023
- $13.99
- + learn more
Sophia Statistics Final Milestone,..pdf

-
Sophia Statistics Final Milestone,..pdf
- Exam (elaborations) • 20 pages • 2023
- $14.48
- + learn more
Sophia Statistics Final Milestone,..pdf
