Math 225n week 2 assignment Study guides, Class notes & Summaries
Looking for the best study guides, study notes and summaries about Math 225n week 2 assignment? On this page you'll find 428 study documents about Math 225n week 2 assignment.
Page 4 out of 428 results
Sort by
-
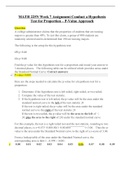
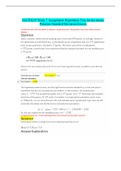
MATH 225N Week 7 Assignment Conduct a Hypothesis Test for Proportion – P-Value Approach
- Exam (elaborations) • 11 pages • 2022
- $8.49
- + learn more
MATH 225N Week 7 Assignment Conduct a Hypothesis Test for Proportion – P-Value Approach Question A college administrator claims that the proportion of students that are nursing majors is greater than 40%. To test this claim, a group of 400 students are randomly selected and its determined that 190 are nursing majors. The following is the setup for this hypothesis test: H0:p=0.40 Ha:p>0.40 Find the p-value for this hypothesis test for a proportion and round your answer to 3 decimal p...
-
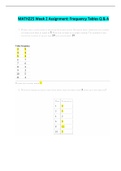
MATH225 Week 2 Assignment / MATH 225N Week 2 Assignment / MATH 225 Week 2 Assignment / MATH225N Week 2 Assignment: (Latest, 2021): Frequency Tables Q & A: Chamberlain College of Nursing |100% Correct Q & A, Download to Secure HIGHSCORE|
- Exam (elaborations) • 20 pages • 2021
- $15.49
- + learn more
MATH225 Week 2 Assignment / MATH 225N Week 2 Assignment / MATH 225 Week 2 Assignment / MATH225N Week 2 Assignment: (Latest, 2021): Frequency Tables Q & A: Chamberlain College of Nursing |100% Correct Q & A, Download to Secure HIGHSCORE| MATH225 Week 2 Assignment / MATH 225N Week 2 Assignment: (Latest): Frequency Tables Q & A : Statistical reasoning for health sciences: Chamberlain College of Nursing MATH225N Week 2 Assignment / MATH 225 Week 2 Assignment: (Latest): Frequency Tables Q & A ...
-
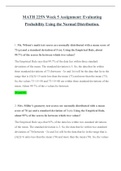
MATH 225N Week 5 Assignment: Evaluating Probability Using the Normal Distribution.
- Exam (elaborations) • 3 pages • 2022
- $5.49
- + learn more
MATH 225N Week 5 Assignment: Evaluating Probability Using the Normal Distribution. 1. Ms. Wilson's math test scores are normally distributed with a mean score of 73 (μ) and a standard deviation of 5 (σ). Using the Empirical Rule, about 99.7% of the scores lie between which two values? The Empirical Rule says that 99.7% of the data lies within three standard deviations of the mean. The standard deviation is 5. So, the data that lie within three standard deviations of 73 (between −3σ a...
-
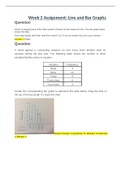
MATH 225N Week 2 Assignment; Line and Bar Graphs
- Other • 14 pages • 2021
- $30.49
- + learn more
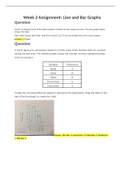
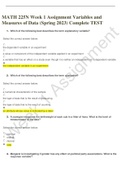
1. Question: A travel agency is conducting research on how many times families went on vacation during the last year. The following table shows the number of times sampled families went on vacation. Create the corresponding bar graph to represent this data below. Drag the dots on the top of the bar graph to create the chart. 2. Question: According to the given data, what can the travel agency conclude about the sampled families? 3. Question: Josslyn is a car salesperson who keeps track of her...
-
MATH 225N Week 3 Discussion: Central Tendency and Variation
- Case • 7 pages • 2022
- $5.49
- + learn more
MATH 225N Week 3 Discussion: Central Tendency and Variation Understanding descriptive statistics, their measures of center and their variability, helps form the foundation of statistical analysis. Descriptive statistics tell us how frequently an observation occurs, what is considered average, and how far data in our sample deviate from being average. With these statistics, we are able to provide a summary of characteristics from both large and small datasets. Measures of central tendency and ...

Make study stress less painful


-
MATH225 Week 2 Assignment / MATH 225N Week 2 Assignment / MATH 225 Week 2 Assignment / MATH225N Week 2 Assignment: (Latest, 2021): Frequency Tables Q & A: Chamberlain College of Nursing |100% Correct Answers, Download to Score “A”|
- Exam (elaborations) • 20 pages • 2021
- $15.49
- + learn more
MATH225 Week 2 Assignment / MATH 225N Week 2 Assignment / MATH 225 Week 2 Assignment / MATH225N Week 2 Assignment: (Latest, 2021): Frequency Tables Q & A: Chamberlain College of Nursing |100% Correct Answers, Download to Score “A”| MATH225 Week 2 Assignment / MATH 225N Week 2 Assignment: (Latest): Frequency Tables Q & A : Statistical reasoning for health sciences: Chamberlain College of Nursing MATH225N Week 2 Assignment / MATH 225 Week 2 Assignment: (Latest): Frequency Tables Q & A ...
-
MATH 225N Week 2 Assignment: Frequency Tables (Q & A)
- Exam (elaborations) • 20 pages • 2021
- $22.49
- + learn more
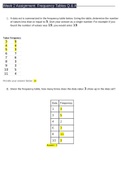
Question: A data set is … in the frequency table below. Using the table, determine the number of values less than or equal to 5. Give your answer as a single number. For example if you found the number of values was 19, you would enter 19. Question: Given the frequency table, how many times does the data value 3show up in the data set? Question: A group of students were … about the number of siblings they have. The frequencies and relative frequencies of their responses are … in the belo...
-
MATH 225N Week 2 Assignment; Line and Bar Graphs: GRADED A+ | 100% GUARANTEED PASS.
- Exam (elaborations) • 14 pages • 2021
- $10.99
- + learn more
Question: A travel agency is conducting research on how many times families went on vacation during the last year. The following table shows the number of times sampled families went on vacation. Cre ate the corresponding bar graph to represent this data below. Drag the dots on the top of the bar graph to create the chart. Question: According to the given data, what can the travel agency conclude about the sampled families? Question: Josslyn is a car salesperson who keeps track of her sales over...
-
MATH 225N Week 1 Assignment Variables and Measures of Data (Spring 2023) Complete TEST
- Exam (elaborations) • 9 pages • 2023
- $12.99
- + learn more
MATH 225N Week 1 Assignment Variables and Measures of Data (Spring 2023) Complete TEST Which of the following best describes the term explanatory variable? Question: Which of the following best describes the term qualitative? Question: A zoologist measures the birthweight of each cub in a litter of lions. What is the level of measurement of the data? Question: Margaret is investigating if gender has any effect on political party associations. What is the response variable?
-
MATH225 Week 7 Assignment (30 Q/A) / MATH 225N Week 7 Assignment / MATH225 Week 7 Assignment / MATH225N Week 7 Assignment: Hypothesis Test for the mean-Polution Standard Deviation known (Latest, 2022): Chamberlain College of Nursing
- Exam (elaborations) • 18 pages • 2022
- $15.49
- 1x sold
- + learn more
MATH225 Week 7 Assignment (30 Q/A) / MATH 225N Week 7 Assignment / MATH225 Week 7 Assignment / MATH225N Week 7 Assignment: Hypothesis Test for the mean-Polution Standard Deviation known (Latest, 2022): Chamberlain College of Nursing MATH225N Week 7 Assignment: Hypothesis Test for the mean-Polution Standard Deviation known MATH225 Week 7 Assignment: Hypothesis Test for the mean-Polution Standard Deviation known Compute the value of the test statistic (z-value) for a hypothesis test...
