Histogram Study guides, Class notes & Summaries
Looking for the best study guides, study notes and summaries about Histogram? On this page you'll find 3040 study documents about Histogram.
Page 4 out of 3.040 results
Sort by

-
MSSC SAFETY ASSESSMENT | 336 Questions with 100% Correct Answers.
- Exam (elaborations) • 49 pages • 2022
- $10.99
- 2x sold
- + learn more
MSSC SAFETY ASSESSMENT | 336 Questions with 100% Correct Answers. 1. An_________ customer is a person or organization that receives services or products in exchange for compensation. a) Internal b) External c) In-house d) Departmental -Ans-External 2. Improving external customer satisfaction is the main objective of __________. a) Customer service department. b) Retired employees c) Maintenance departments d) HR departments. -Ans-customer service 3. Vendors could be considered what ty...
-
EPPP Exam Questions and Answers Already Passed
- Exam (elaborations) • 597 pages • 2024
- $15.49
- + learn more
EPPP Exam Questions and Answers Already Passed In which type of graph do the bars touch to indicate the overlapping nature of the data? a) bar graph b) histogram c) pie chart d) scatterplot histogram Which scale of measurement is dichotomous/categorical and does not have a sp order, equal intervals or an absolute zero? a) nominal b) ordinal c) interval d) ratio nominal Which scale of measurement would be used to measure the places achieved in a horse race? a) nominal b) or...

-
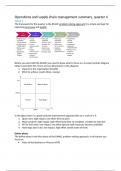
Supply chain and management International Business year 2
- Summary • 25 pages • 2023
- $8.88
- 1x sold
- + learn more
In this document the different phases within supply chain management are discussed. Also different models are discussed: audit cycle, KPI tree, impact effort matrix, weighted decision matrix, 5 whys analysis, fishbone diagram, Yamazumi dashboard, Spaghetti diagram, layout warehouse, layout store, layout factory, time series plots, histogram, bar and pie charts, scatter plots, Pareto chart, define project charter, DMAIC
-
Statistics 100 Final Review Questions With Complete Solutions
- Exam (elaborations) • 23 pages • 2023
- $10.99
- + learn more
Statistics 100 Final Review Questions With Complete Solutions We record the zip codes of newly admitted students. How should we treat this data? correct answer: As categorical data We record the wavelengths of light reflecting off of several bird-of-paradise feathers. How should we treat this data? correct answer: as numeric data We record the genus of every tree identified along a transect. How should we treat this data? correct answer: as categorical data The height of bars in a h...

-
WGU C215 Study Guide - FINAL Exam with 100% Correct Answers 2023
- Exam (elaborations) • 18 pages • 2023
- $16.99
- 3x sold
- + learn more
Total Quality Management (TQM) Philosophy - Correct answer-1. customer focus 2. continuous improvement 3. employee empowerment 4. use of quality tools 5. product design 6. process management 7. managing supplier quality Process Capability Index (Cpk) - Correct answer-Basic function of Six Sigma. Measures the process potential and performance of processes. The higher the range of Cpk, the improved is the ability of the process to complete its necessities. Six Sigma - Correct answer-A di...

Make study stress less painful

-
Understandable Statistics Concepts and Methods 12th Edition by Charles Henry Brase – Test Bank
- Exam (elaborations) • 25 pages • 2022
- $15.49
- 1x sold
- + learn more
1. Give an example of a discrete random variable. a. The number of inches of rainfall in a county b. The number of beverages sold at a lemonade stand c. The number of gallons of concrete used at a construction site d. The time required for a runner to finish a marathon e. The temperature of a pot roast cooking in an oven ANSWER: b POINTS: 1 DIFFICULTY: Easy QUESTION TYPE: Multi-Mode (Multiple choice) HAS VARIABLES: False LEARNING OBJECTIVES: 13.65 – Identify a discrete random variab...
-
Straighterline Introduction to Statistics questions with complete solutions 2023
- Exam (elaborations) • 5 pages • 2023
- $10.99
- 2x sold
- + learn more
Straighterline Introduction to Statistics questions with complete solutions 2023Four steps in the process of statistics 1. Producing Data 2. Exploratory Data Analysis 3. Probability 4. Inference Categorical variable places individuals into one of several groups Two types: nominal and ordinal Quantitative Variable represents a measurement or a count Two types: Interval and ratio Nominal Variable categorical variables where there is no natural order among the categori...
-
BSTAT 2305 FINAL Q&A
- Exam (elaborations) • 26 pages • 2023
- $14.99
- + learn more
The following histogram represents the number of pages in each book within a collection. What is the frequency of books containing at least 250 but fewer than 400 pages? - Answer- 11 Add the frequencies, 7, 3, and 1, for the classes 250 up to 300, 300 up to 350, and 350 up to 400. The accompanying relative frequency distribution represents the last year car sales for the sales force at Kelly's Mega Used Car Center. Car Sales - Relative Frequency 35 up to 45 - 0.07 45 up to ...

-
EPI 522 Midterm Quiz Summary- Rush University 2023/24
- Exam (elaborations) • 20 pages • 2023
- $18.99
- + learn more
EPI 522 Midterm Quiz Summary- Rush University 2023/24 Height recorded in centimeters should be displayed using SELECT ALL THAT APPLY Bar chart. Box-and-whisker plot. Stem-and-leaf plot. Histogram. Question 2 The dependent variable is The intervention being studied. The experiemental variable. The variable manipulated by the researcher. The outcome variable. Question 3 A student is planning on conducting a quality improvement project on a unit in the university hospital where the s...
-
SASB Level II Questions with Correct Answers 100% Verified 2024/2025
- Exam (elaborations) • 11 pages • 2024
- $9.99
- + learn more
SASB Level II Questions with Correct Answers 100% Verified 2024/2025 Recognizing Data Types Question - Correct Answers 1. Does the Metric yield Discrete Data? 2.Does the metric yield Continuous Data? 3.What is the possible range of performance on a topic? Discrete Data - Correct Answers Data that can only take certain values. IE Number of Requests or Number of data breaches. continous data - Correct Answers Numerical data that is not discrete. Can include fractions, infinitely divisible...
