Business analytics Study guides, Class notes & Summaries
Looking for the best study guides, study notes and summaries about Business analytics? On this page you'll find 4038 study documents about Business analytics.
Page 4 out of 4.038 results
Sort by
-
Solution Manual for Introduction to Business Analytics, 1st Edition By Vernon Richardson and Marcia Watson, Verified Chapters 1 - 12 | Complete Newest Version
- Exam (elaborations) • 152 pages • 2023
- $19.99
- 1x sold
- + learn more
Solution Manual for Introduction to Business Analytics, 1st Edition By Vernon Richardson and Marcia Watson, Verified Chapters 1 - 12 | Complete Newest Version Solution Manual for Introduction to Business Analytics, 1st Edition By Vernon Richardson and Marcia Watson, Verified Chapters 1 - 12 | Complete Newest Version Solution Manual for Introduction to Business Analytics, 1st Edition By Vernon Richardson and Marcia Watson, Verified Chapters 1 - 12 | Complete Newest Version Solution Manual for In...
-
Test Bank for Business Analytics, 2nd Edition by Sanjiv Jaggia
- Exam (elaborations) • 428 pages • 2022
- $39.99
- 5x sold
- + learn more
Test Bank for Business Analytics: Communication with numbers 2e 2nd edition by Sanjiv Jaggia and Alison Kelly and Kevin Lertwachara and Leida Chen. ISBN-10: 0 ISBN-13: 2802 Complete Chapters test bank PDF Chapter 1: Introduction to Business Analytics Chapter 2: Data Management and Wrangling Chapter 3: Summary Measures Chapter 4: Data Visualization Chapter 5: Probability and Probability Distributions Chapter 6: Statistical Inference Chapter 7: Regression Analysis...
-
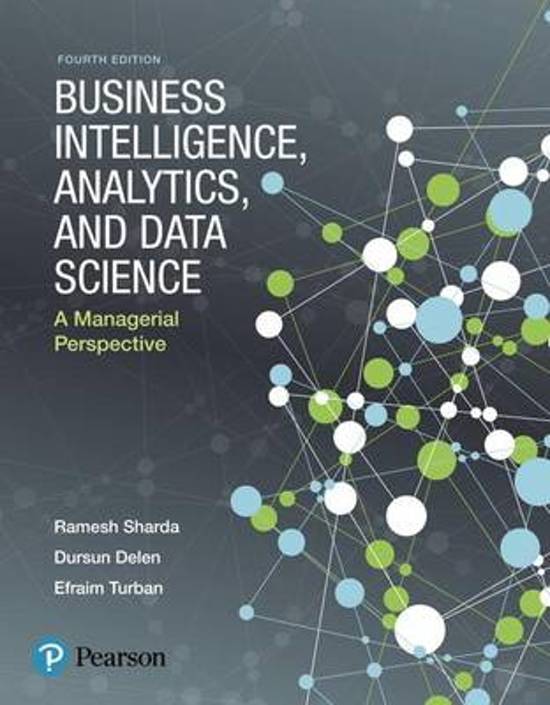
TEST BANK for Business Intelligence, Analytics, and Data Science: A Managerial Perspective, 4th edition Ramesh Sharda, Dursun Delen and Efraim Turban. ISBN-13: 9780137305711.
- Exam (elaborations) • 93 pages • 2023
- $33.61
- 3x sold
- + learn more
TEST BANK for Business Intelligence, Analytics, and Data Science: A Managerial Perspective, 4th edition Ramesh Sharda, Dursun Delen and Efraim Turban. ISBN-13: 5711. An Overview of Business Intelligence, Analytics, and Data Science Descriptive Analytics I: Nature of Data, Statistical Modeling, and Visualization Descriptive Analytics II: Business Intelligence and Data Warehousing Predictive Analytics I: Data Mining Process, Methods, and Algorithms Predictive Analytics II: Text, Web, and Social Me...
-
Summary - Business Analytics and Emerging Trends (BAET) - Master Information Management
- Summary • 76 pages • 2023
- $6.59
- 6x sold
- + learn more
This summary contains notes from all lectures. Passed my exam thanks to this summary.
-
Samenvatting Business Intelligence & Business Analytics (320092)
- Summary • 50 pages • 2023
- $6.00
- 2x sold
- + learn more
Complete summary of lectures from the course Business Intelligence & Business Analytics

And that's how you make extra money

-
Solution manual for introduction to business analytics 1st edition by vernon richardson and marcia Watson 100% VERIFIED ANSWERS 2023/2024
- Exam (elaborations) • 151 pages • 2023
- $23.99
- 1x sold
- + learn more
QUESTIONS AND ANSWERS
-
Solutions for Cost Accounting: With Integrated Data Analytics, 1st Edition by Farmer
- Exam (elaborations) • 978 pages • 2023
- $39.49
- 6x sold
- + learn more
Complete Solutions Manual for Cost Accounting: With Integrated Data Analytics, 1st Edition 1e by Karen Congo Farmer, Amy Fredin. Full Chapters Solutions Manual are included - Chapter 1 to 18 Cost Accounting Has Purpose 2 Refresher on Cost Terms 3 Cost Behavior and Cost Estimation 4 Cost-Volume-Profit Analysis 5 Relevant Costs for the Decision Maker 6 Mastering the Master Budget 7 Capital Budgeting Choices and Decisions 8 Job Costing Visualized 9 Activity-Based Costing 10 Variance Analysis and...
-
Business Statistics and Analytics in Practice 9th Edition Bowerman Test Bank
- Exam (elaborations) • 1963 pages • 2022
- $16.73
- 2x sold
- + learn more
Student name:__________ TRUE/FALSE - Write 'T' if the statement is true and 'F' if the statement is false. 1) A stem-and-leaf display is a graphical portrayal of a data set that shows the data set's overall pattern of variation. ⊚ true ⊚ false 2) The relative frequency is the frequency of a class divided by the total number of measurements. ⊚ true ⊚ false 3) A bar chart is a graphic that can be used to depict qualitative data. ⊚ true ⊚ false 4) Stem-and-leaf displays and dot plo...
