Math534 Study guides, Class notes & Summaries
Looking for the best study guides, study notes and summaries about Math534? On this page you'll find 255 study documents about Math534.
Page 3 out of 255 results
Sort by
-
MATH 534 Week 7 Course Project, Final Part C_ Regression and Correlation Analysis (Keller 2023).docx
- Other • 4 pages • 2023
- $30.48
- + learn more
MATH 534 Week 7 Course Project, Final Part C_ Regression and Correlation Analysis (Keller 2023).docx
-
MATH 534 Week 3 Quiz
- Exam (elaborations) • 8 pages • 2023
- $20.99
- + learn more
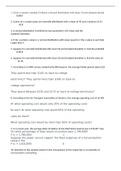
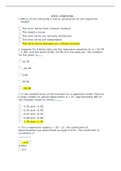
1. Question: Given a random variable X follows a Normal distribution with mean 10 and standard deviation 2. Question: Scores on a certain exam are normally distributed with a mean of 90 and a variance of 25. 3. Question: A normal distribution is defined by two parameters, the mean and the Standard Deviation 4. Question: If for a certain x value in a normal distribution with mean equal to 4 the z-value is such that Larger than 4 5. Question: Suppose X is normally distributed with mean 50 and ...
-
MATH 534 Week 5 Quiz
- Exam (elaborations) • 9 pages • 2023
- $20.49
- + learn more
1. Question: In a hypothesis test, the test statistic computed from the sample data is considered extreme or significant if it is __________ 2. Question: A test of the hypotheses, H0: p = 0.18 and H1: p ≠ 0.18 is a _______________. 3. Question: An analyst tested the null hypothesis µ ≥ 30 against the alternative hypothesis that µ < 30. The analyst reported a p-value of 0.07. For what significance level of α will the null hypothesis would be rejected? 4. Question: The dean of a busi...
-
MATH 534 Week 7 Homework Problems
- Exam (elaborations) • 5 pages • 2023
- $21.48
- + learn more
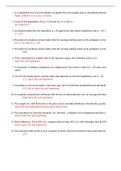
1. Question:Arealestateanalysthasdevelopedamultipleregressionline,y=60+0.068x1–2.5x2,topredicty=themarketpriceofahome(in $1,000s),usingindependentvariables,x1=thetotalnumberofsquare feetoflivingspace,andx2=theageofthehouseinyears.The regressioncoefficientofx2suggeststhis: _____. 2. Question:Thefollowingisapartialcomputeroutputofamultipleregressionanalysis of a data set containing 20 sets of observations on thedependentvariable. Theregressionequationis SALEPRIC=1470+0.8145LANDVAL+0.8204IMP...
-
MATH 534 Week 6 Homework Problems
- Exam (elaborations) • 5 pages • 2023
- $26.48
- + learn more

Want to regain your expenses?


-
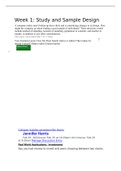
MATH 534 Week 1 Discussion; Study and Sample Design (Keller)
- Other • 8 pages • 2023
- $12.99
- + learn more
A company makes men's button-up dress shirts and is considering changes to its design. Howmight the company go about finding a good sample of individuals? These decisions wouldincludemethodofsampling,locationofsampling,populationtoconsider,andnumberinsample,in additionto any other considerations.
-
MATH 534 Week 1 Quiz
- Exam (elaborations) • 8 pages • 2023
- $25.48
- + learn more
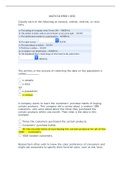
1. Question: Classify each of the following as nominal, ordinal, interval, or ratio data. 2. Question: The activity or the process of collecting the data on the population is called . 3. Question: A company wants to learn the customers’ purchase habits of buying certain products. This company did a survey about a random 1000 customers, who were asked about the times they purchased the certain products within one month. Then what is the data in this example: 4. Question: Researchers often wi...
-
MATH 534 Week 1 Discussion; Study and Sample Design (Keller)
- Other • 8 pages • 2023
- $15.49
- + learn more
A company makes men's button-up dress shirts and is considering changes to its design. Howmight the company go about finding a good sample of individuals? These decisions wouldincludemethodofsampling,locationofsampling,populationtoconsider,andnumberinsample,in additionto any other considerations.
-
MATH 534 Week 8 Discussion
- Other • 3 pages • 2023
- $18.48
- + learn more
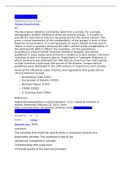
The descriptive statistics summarize data from a sample, for example, demographicprofiles. Whenever there are several groups, it is useful to provide the descriptivestatistics by group and for the overall sample. This gives a visual impression of thecomparabilityofthe groupsin termoftheir baseline characteristics.Itis notnecessaryto report statistical tests and P-values in such a summary because the main concern isthe comparability of the participants (which reflects the sampling), not the popul...

-
MATH 534 Week 7 Course Project, Final Part C; Regression and Correlation Analysis
- Other • 4 pages • 2023
- $25.49
- + learn more
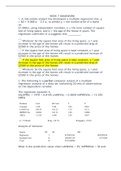
Final Project: Regression and Correlation Analysis Use the dependent variable (labeled Y) and one of the independent variables (labeled X1, X2, and X3) in the data file. Select and use one independent variable throughout this analysis. Use Excel to perform the regression and correlation analysis to answer the following. The week 6 spreadsheet can ... helpful in this work. 1. Generate a scatterplot for the ... dependent variable (Y) and the ... independent variable (X), including the graph of t...
