H30 Study guides, Class notes & Summaries
Looking for the best study guides, study notes and summaries about H30? On this page you'll find 1081 study documents about H30.
Page 3 out of 1.081 results
Sort by
-
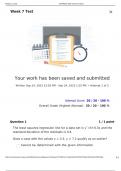
MATH302 Week 7 Test
- Exam (elaborations) • 47 pages • 2023
- $28.49
- + learn more
1. Question: The least squares regression line for a data set is yˆ=5+0.3x and the standard deviation of the residuals is 0.4. Does a case with the values x = 3.3, y = 7.2 qualify as an outlier? 2. Question: The least squares regression line for a data set is yˆ=5+0.3x and the standard deviation of the residuals is 0.52. Does a case with the values x = -1.59, y = 5.78 qualify as an outlier? 3. Question: The following data represent the weight of a child riding a bike and the rolling distance...
-
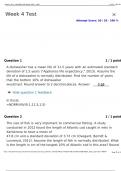
MATH302 Week 4 Test
- Exam (elaborations) • 17 pages • 2023
- $35.99
- + learn more
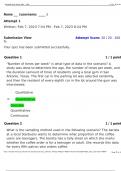
1. Question: A dishwasher has a mean life of 11.5 years with an estimated standard deviation of 1.5 years ("Appliance life expectancy," 2013). Assume the life of a dishwasher is normally distributed. Find the number of years that the bottom 10% of dishwasher would last. Round answer to 2 decimal places. 2. Question: The size of fish is very important to commercial fishing. A study conducted in 2012 found the length of Atlantic cod caught in nets in Karlskrona to have a mean of 47.8 cm and a s...
-
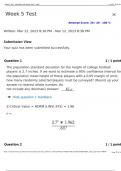
MATH302 Week 5 Test
- Exam (elaborations) • 15 pages • 2023
- $30.48
- + learn more
1. Question: The population standard deviation for the height of college football players is 2.7 inches. If we want to estimate a 95% confidence interval for the population mean height of these players with a 0.65 margin of error, how many randomly selected players must be surveyed? 2. Question: The population standard deviation for the height of college basketball players is 2.9 inches. If we want to estimate a 99% confidence interval for the population mean height of these players with a 0.45...
-
MATH302 Week 6 Test
- Exam (elaborations) • 24 pages • 2023
- $28.49
- + learn more
1. Question: A manager wishes to see if the time (in minutes) it takes for their workers to complete a certain task is faster if they are wearing earbuds. A random sample of 20 workers' times were collected before and after wearing earbuds. Test the claim that the time to complete the task will be faster, i.e. meaning has production increased, at a significance level of α = 0.01 For the context of this problem, µD = µbefore−µafter where the first data set represents before earbuds and the...

-
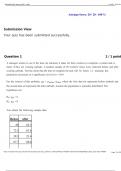
MATH302 Week 8 Test
- Exam (elaborations) • 27 pages • 2023
- $32.49
- + learn more
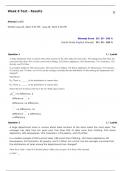
1. Question: A large department store is curious about what sections of the store make the most sales. The manager has data from ten years prior that show 30% of sales come from Clothing, 25% Home Appliances, 18% Housewares, 13% Cosmetics, 12% Jewelry, and 2% Other. In a random sample of 550 current sales, 188 came from Clothing, 153 Home Appliances, 83 Housewares, 54 Cosmetics, 61 Jewelry, and 11 Other. At α=0.10, can the manager conclude that the distribution of sales among the departments ha...

Make study stress less painful


-
MATH302 Week 5 Test
- Exam (elaborations) • 15 pages • 2023
- $35.99
- + learn more
1. Question: The population standard deviation for the height of college football players is 2.7 inches. If we want to estimate a 95% confidence interval for the population mean height of these players with a 0.65 margin of error, how many randomly selected players must be surveyed? 2. Question: The population standard deviation for the height of college basketball players is 2.9 inches. If we want to estimate a 99% confidence interval for the population mean height of these players with a 0.45...

-
MATH302 Week 1 Test
- Exam (elaborations) • 15 pages • 2023
- $35.99
- + learn more
1. Question: "Number of times per week" is what type of data in the scenario? A study was done to determine the age, the number of times per week, and the duration (amount of time) of residents using a local gym in San Antonio, Texas. The first car in the parking lot was selected randomly, and then the resident of every eighth car in the lot around the gym was interviewed. 2. Question: What is the sampling method used in the following scenario? The barista at a local Starbucks wants to determ...

-
MATH302 Week 7 Test
- Exam (elaborations) • 47 pages • 2023
- $28.49
- + learn more
1. Question: The least squares regression line for a data set is yˆ=5+0.3x and the standard deviation of the residuals is 0.4. Does a case with the values x = 3.3, y = 7.2 qualify as an outlier? 2. Question: The least squares regression line for a data set is yˆ=5+0.3x and the standard deviation of the residuals is 0.52. Does a case with the values x = -1.59, y = 5.78 qualify as an outlier? 3. Question: The following data represent the weight of a child riding a bike and the rolling distance...
-
MATH302 Week 1 Test
- Exam (elaborations) • 15 pages • 2023
- $34.99
- + learn more
1. Question: "Number of times per week" is what type of data in the scenario? A study was done to determine the age, the number of times per week, and the duration (amount of time) of residents using a local gym in San Antonio, Texas. The first car in the parking lot was selected randomly, and then the resident of every eighth car in the lot around the gym was interviewed. 2. Question: What is the sampling method used in the following scenario? The barista at a local Starbucks wants to determ...
-
MATH302 Week 8 Test
- Exam (elaborations) • 27 pages • 2023
- $29.49
- + learn more
1. Question: A large department store is curious about what sections of the store make the most sales. The manager has data from ten years prior that show 30% of sales come from Clothing, 25% Home Appliances, 18% Housewares, 13% Cosmetics, 12% Jewelry, and 2% Other. In a random sample of 550 current sales, 188 came from Clothing, 153 Home Appliances, 83 Housewares, 54 Cosmetics, 61 Jewelry, and 11 Other. At α=0.10, can the manager conclude that the distribution of sales among the departments ha...
