Math302 week 5 test 5 Study guides, Class notes & Summaries
Looking for the best study guides, study notes and summaries about Math302 week 5 test 5? On this page you'll find 20 study documents about Math302 week 5 test 5.
Page 2 out of 20 results
Sort by

-
MATH302 Week 5 Test
- Exam (elaborations) • 15 pages • 2023
- $28.49
- + learn more
1. Question: The population standard deviation for the height of college football players is 2.7 inches. If we want to estimate a 95% confidence interval for the population mean height of these players with a 0.65 margin of error, how many randomly selected players must be surveyed? 2. Question: The population standard deviation for the height of college basketball players is 2.9 inches. If we want to estimate a 99% confidence interval for the population mean height of these players with a 0.45...

-
MATH302 Week 5 Test
- Exam (elaborations) • 15 pages • 2023
- $34.99
- + learn more
1. Question: The population standard deviation for the height of college football players is 2.7 inches. If we want to estimate a 95% confidence interval for the population mean height of these players with a 0.65 margin of error, how many randomly selected players must be surveyed? 2. Question: The population standard deviation for the height of college basketball players is 2.9 inches. If we want to estimate a 99% confidence interval for the population mean height of these players with a 0.45...
-
MATH302 Week 5 Test
- Exam (elaborations) • 15 pages • 2023
- $31.49
- + learn more
1. Question: The population standard deviation for the height of college football players is 2.7 inches. If we want to estimate a 95% confidence interval for the population mean height of these players with a 0.65 margin of error, how many randomly selected players must be surveyed? 2. Question: The population standard deviation for the height of college basketball players is 2.9 inches. If we want to estimate a 99% confidence interval for the population mean height of these players with a 0.45...

-
MATH302 WEEK 7 TEST
- Exam (elaborations) • 38 pages • 2022
- $17.49
- + learn more
MATH302 WEEK 7 TEST Part 1 of 7 - Linear Regression and Correlation; Outliers and Values of Correlation 2.0/ 2.0 Points Question 1 of 20 1.0/ 1.0 Points The least squares regression line for a data set is yˆ=5+0.3x and the standard deviation of the residuals is 0.52. Does a case with the values x = -1.59, y = 5.78 qualify as an outlier? A. Cannot be determined with the given information B. No C. Yes Answer Key: C Feedback: Plug in -1.59 for x. y = 5 + .3*-1.59 ...

-
MATH302 WEEK 7 TEST
- Exam (elaborations) • 38 pages • 2022
- $10.49
- + learn more
MATH302 WEEK 7 TEST Part 1 of 7 - Linear Regression and Correlation; Outliers and Values of Correlation 2.0/ 2.0 Points Question 1 of 20 1.0/ 1.0 Points The least squares regression line for a data set is yˆ=5+0.3x and the standard deviation of the residuals is 0.52. Does a case with the values x = -1.59, y = 5.78 qualify as an outlier? A. Cannot be determined with the given information B. No C. Yes Answer Key: C Feedback: Plug in -1.59 for x. y = 5 + .3*-1.59 ...

Fear of missing out? Then don’t!

-
Week 2 Knowledge Check Homework Practice Questions - SOLVED
- Exam (elaborations) • 14 pages • 2021
- $9.99
- + learn more
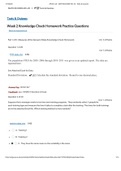
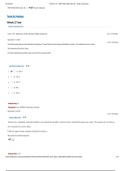
Week 2 Knowledge Check Homework Practice Questions Return to Assessment List Part 1 of 8 - Measures of the Spread of Data Knowledge Check Homework 1.0/ 3.0 Points Question 1 of 20 FTES 8 KB The population FTES for 2005–2006 through 2010–2011 was given in an updated report. The data are reported here. See Attached Excel for Data. Standard Deviation: 167 Calculate the standard deviation. Round to one decimal place. Answer Key: 167.0| 167 Feedback: use =STDEV.S functio...
-
MATH302 Week 5 TEST COMPLETE QUESTIONS AND ANSWERS 2023 GRADED A+.
- Exam (elaborations) • 13 pages • 2023
- $11.49
- + learn more
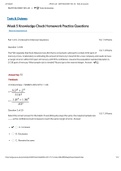
MATH302 Week 5 TEST COMPLETE QUESTIONS AND ANSWERS 2023 GRADED A+. Part 1 of 4 - Z-interval for Unknown Questions 7.0/ 7.0 Points Question 1 of 20 1.0/ 1.0 Points There is no prior information about the proportion of Americans who support gun control in 2019. If we want to estimate 93% confidence interval for the true proportion of Americans who support gun control in 2019 with a 0.18 margin of error, how many randomly selected Americans must be surveyed? Answer: (Round up your answer t...
-
Week 5 Knowledge Check Homework Practice Questions - SOLVED
- Exam (elaborations) • 12 pages • 2021
- $9.99
- + learn more
Week 5 Knowledge Check Homework Practice Questions Return to Assessment List Part 1 of 4 - Z-interval for Unknown Questions 7.0/ 7.0 Points Question 1 of 20 The FDA regulates that fresh Albacore tuna fish that is consumed is allowed to contain 0.82 ppm of mercury or less. A laboratory is estimating the amount of mercury in tuna fish for a new company and needs to have a margin of error within 0.03 ppm of mercury with 95% confidence. Assume the population standard deviation is 0.138 ppm of...
-
MATH302 Week 4 Test questions and answers new 2020-2021 practice docs
- Exam (elaborations) • 10 pages • 2020
- $8.49
- 1x sold
- + learn more
MATH302 Week 4 Test questions and answers new 2020-2021 practice docs Part 1 of 6 - Calculations of Probabilities Questions 2.0/ 3.0 Points Question 1 of 20 0.0/ 1.0 Points The mean yearly rainfall in Sydney, Australia, is about 134 mm and the standard deviation is about 66 mm ("Annual maximums of," 2013). Assume rainfall is normally distributed. How many yearly mm of rainfall would there be in the top 15%? Round answer to 2 decimal places. Question 2 of 20 1.0/ 1.0 Points ...
-
Exam (elaborations) Math 302 WEEK 2
- Exam (elaborations) • 12 pages • 2021
- $14.99
- + learn more
Week 2 Test Return to Assessment List Part 1 of 8 - Measures of the Spread of Data Questions 3.0/ 3.0 Points Question 1 of 20 The following data are the distances between 21 retail stores and a large distribution center. The distances are in miles. See Attached Excel for Data. Find the standard deviation and round to the nearest tenth retail store 8 KB A. 36.3 B. 79.5 C. 35.5 D. 96 E. 34.5 Answer Key: A Feedback: use =STEDV.S function in Excel. Question 2 of 20 ...
