Exam (elaborations) Math 302 WEEK 2
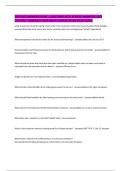
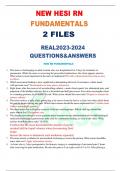
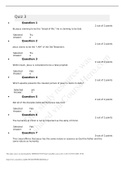
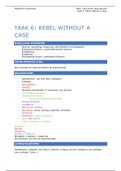
Week 2 Test Return to Assessment List Part 1 of 8 - Measures of the Spread of Data Questions 3.0/ 3.0 Points Question 1 of 20 The following data are the distances between 21 retail stores and a large distribution center. The distances are in miles. See Attached Excel for Data. Find the standard deviation and round to the nearest tenth retail store 8 KB A. 36.3 B. 79.5 C. 35.5 D. 96 E. 34.5 Answer Key: A Feedback: use =STEDV.S function in Excel. Question 2 of 20 movie 9 KB Twenty-five randomly selected students were asked the number of movies they watched the previous week. The results are as follows: See Attached Excel for Data. Find the approximate sample standard deviation, s Round to two decimal places. 1.12 . Answer Key: 1.12 MATH302 B002 Spr 20 Tests & Quizzes Tests & Quizzes4/19/2020 APUS CLE : MATH302 B002 Spr 20 : Tests & Quizzes 1.0/ 1.0 Points 1.0/ 1.0 Points 0.0/ 1.0 Points Feedback: use =STDEV.S function in Excel. Question 3 of 20 final grade 8 KB An instructor wants to compare spread (variation) of final grades of students in her online class and face-to-face class. The instructor selects 10 students randomly from each class and the following table shows the final grades of those students. See Attached Excel for Data. The standard deviation of final grades for the online class is 7.83 . Use the information to respond to the following question:(round to 2 decimal places) Answer Key: 7.83 Feedback: use =STEDV.S function in Excel. Part 2 of 8 - Box Plot Questions 1.0/ 2.0 Points Question 4 of 20 Boxplots are most useful for: A. comparing the mean to the median B. calculating the mean of the data C. comparing two populations graphically D. calculating the median of the data Answer Key: C Question 5 of 20 Santa Clara County, CA, has approximately 27,873 Japanese-Americans. Their ages are as follows : Age Group Percent of Community 0-17 18.9 18-24 8.0 25-34 22.8 35-44 15.0 45-54 13.1 55-64 11.94/19/2020 APUS CLE : MATH302 B002 Spr 20 : Tests & Quizzes 1.0/ 1.0 Points 65+ 10.3 Which box plot most resembles the information above? A. B. C. Answer Key: A Part 3 of 8 - Displaying Data Questions 1.0/ 2.0 Points Question 6 of 20 The following data represents the percent change in tuition levels at public, four-year colleges (inflation adjusted) from 2008 to 2013 (Weissmann, 2013). Below is the frequency distribution and histogram.4/19/2020 APUS CLE : MATH302 B002 Spr 20 : Tests & Quizzes Class Limits Class Midpoint Frequency Relative Frequency 2.2 – 11.7 6.95 6 0.12 11.8 – 21.3 16.55 20 0.40 21.4 – 30.9 26.15 11 0.22 31.0 – 40.5 35.75 4 0.08 40.6 – 50.1 45.35 2 0.04 50.2 – 59.7 54.95 2 0.04 59.8 – 69.3 64.55 3 0.06 69.4 – 78.9 74.15 2 0.04 How many colleges were sampled?4/19/2020 APUS CLE : MATH302 B002 Spr 20 : Tests & Quizzes 0.0/ 1.0 Points 1.0/ 1.0 Points A. 78 B. 35 C. 50 D. 100 E. 20 Answer Key: C Feedback: 6+20+11+4+2+2+3+2 Question 7 of 20 Match each word with the description. A. tells the number of data points that have each value B. shows the proportion of data points that have each value A 1. relative frequency B 2. frequency Answer Key: 1:B, 2:A Part 4 of 8 - Measures of Central Tendency Questions 4.0/ 4.0 Points Question 8 of 20 boat length 8 KB The following data show the lengths of boats moored in a marina. The data are ordered from smallest to largest.4/19/2020 APUS CLE : MATH302 B002 Spr 20 : Tests & Quizzes 1.0/ 1.0 Points 1.0/ 1.0 Points 1.0/ 1.0 Points See Attached Excel for Data. Calculate the mean. Round your answer to one decimal place. 27.3 Answer Key: 27.3 Feedback: =AVERAGE function in Excel Question 9 of 20 height 8 KB The following data show the height (in inches) of a sample of students. See Attached Excel for Data. The median height of these students is 64 inches. Do Not Round. Answer Key: 64 Feedback: use =MEDIAN function in Excel. Question 10 of 20 The lengths (in kilometers) of rivers on the South Island of New Zealand that flow to the Tasman Sea are listed below. Find the mode. See Attached Excel for Data. river length 9 KB A. 32 B. no mode C. 56 & 64 D. 56 E. 64 Answer Key: C Feedback: The two values that appear most often are 56 and 64. Question 11 of 20 A sample of 8 cats found the following weights in kg. What is the mode weight? See Attached Excel for Data. cat weight 8 KB4/19/2020 APUS CLE : MATH302 B002 Spr 20 : Tests & Quizzes 1.0/ 1.0 Points 1.0/ 1.0 Points A. 3.7 kg B. 4.1 kg C. 3.2 kg D. 0 kg E. No mode Answer Key: A Feedback: The value that appears most often is the mode, 3.7 Part 5 of 8 - Measures of the Location of Data Questions 3.0/ 3.0 Points Question 12 of 20 final grade 8 KB An instructor wants to compare the final grades of students in her online class and face-to-face class. The instructor selects 10 students randomly from each class and the following table shows the final grades of those students. See Attached Excel for Data. Hint: Use =PERCENTILE.INC function in Excel or use textbook formula (n+1)p/100 Compute the following percentiles and interpret them. (round to two decimal places) The 62nd percentile of final grades for the online class is 83.16 . The 62nd percentile of final grades for the face-to-face class is 88.16 . Answer Key: 83.16, 88.16 Feedback: Use PERCENTILE.INC( , .62) in Excel. Question 13 of 20 cholesterol 8 KB Cholesterol levels were collected from patients two days after they had a heart attack (Ryan, Joiner & Ryan, Jr, 1985). Use Excel to find the 25th percentile. Round your answer to one decimal place. See Attached Excel for Data. Answer= 225.5 Hint: Use =PERCENTILE.INC function in Excel or use textbook formula (n+1)p/100 Retrieved from Answer Key: 225.5 Feedback: Use =PERCENTILE.INC( , .25) in Excel.4/19/2020 APUS CLE : MATH302 B002 Spr 20 : Tests & Quizzes 1.0/ 1.0 Points 1.0/ 1.0 Points Question 14 of 20 sleep hours 8 KB The following data show the average time (in hours) that a random sample of 8 students sleep per night. See Attached Excel for Data. The 81st percentile of time students sleep per night is 8.1 hours. Round to 1 decimal place. Answer Key: 8.1 Feedback: Use =PERCENTILE.INC( , .81) in Excel. Part 6 of 8 - Ogives, Pareto and Pie Chart Questions 1.0/ 2.0 Points Question 15 of 20 The following table summarizes the proportion of people who prefer different food for lunch. Lunch Choices Proportion Mac ‘n Cheese 0.24 Sandwich 0.36 Soup 0.28 Hamburger 0.08 Chicken Nuggets 0.04 Select the correct bar graph for the distribution of people by their lunch choice.4/19/2020 APUS CLE : MATH302 B002 Spr 20 : Tests & Quizzes A. B. 4/19/2020 APUS CLE : MATH302 B002 Spr 20 : Tests & Quizzes 0.0/ 1.0 Points C. Answer Key: C Question 16 of 20 The total frequency of the data whose ogive is shown below is approximately A. 12 B. 18 C. 90 D. 34 Answer Key: D Feedback: The frequency count is along the y-axis. Part 7 of 8 - Scatter Plots Questions 2.0/ 2.0 Points4/19/2020 APUS CLE : MATH302 B002 Spr 20 : Tests & Quizzes 1.0/ 1.0 Points 1.0/ 1.0 Points Question 17 of 20 A time series plot is essentially a: A. histogram B. figure C. Scatterplot D. diagram Answer Key: C Question 18 of 20 The Australian Institute of Criminology gathered data on the number of deaths (per 100,000 people) due to firearms during the period 1983 to 1997. The time-series plot is below. What year had the highest rate of deaths? Retrieved from A. 1983 B. 1989 C. 1985 D. 1997 Answer Key: C Feedback: 1985 along the x-axis has the highest peak along the y-axis. Part 8 of 8 - Stem and Leaf Questions 2.0/ 2.0 Points Question 19 of 204/19/2020 APUS CLE : MATH302 B002 Spr 20 : Tests & Quizzes 1.0/ 1.0 Points 1.0/ 1.0 Points The following data show the height (in inches) of sample of students. Create a stem leaf plot for these data and then select all of the correct statements about these data based on your plot. A. 50% of students have height less than 65 inches B. The maximum height observed is 67 inches C. More students have height of 65 inches or more D. The maximum observed height is 71 inches E. None of these are correct Answer Key: C, D Feedback: More students have height of 65 inches or more The maximum observed height is 71 inches. Only 4 heights are less than 65 inches. Stem Leaf 6 7 0111 Question 20 of 20 An instructor had the following grades recorded for an exam. What is the value of the missing leaf? Exam Grades: 83 69 79 70 83 6 3 5 6 9 7 0 1 3 5 6 9 8 0 1 2 2 3 3 3 3 5 5 6 7 9 4 6 9 Answer Key: 6 Feedback: 96 is missing, thus the missing leaf is 6 Powered by Sakai Copyright The Apereo Foundation. All rights reserved. Portions of Sakai are copyrighted by other parties as described in th
Written for
- Institution
-
American Public University
- Course
-
Math 302
Document information
- Uploaded on
- March 17, 2021
- Number of pages
- 12
- Written in
- 2020/2021
- Type
- Exam (elaborations)
- Contains
- Questions & answers
Subjects
-
100 correct question and answers
-
math302math 302