Coun 6360 week 9 Study guides, Class notes & Summaries
Looking for the best study guides, study notes and summaries about Coun 6360 week 9? On this page you'll find 15 study documents about Coun 6360 week 9.
Page 2 out of 15 results
Sort by
-
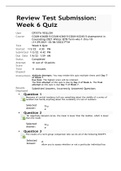
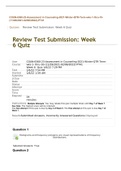
COUN-6360D-5/COUN-6360-5/COUN-6324S-5-Assessment in Counseling-2021-Winter-QTR-Term- COUN 6360D Week 6 Quiz
- Exam (elaborations) • 3 pages • 2022
- $9.99
- + learn more
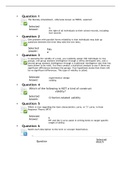
COUN-6360D-5/COUN-6360-5/COUN-6324S-5-Assessment in Counseling-2021-Winter-QTR-Term-wks-1-thru-10 COUN 6360D Week 6 Quiz 1. Measures of central tendency tell you something about the middle of a series of numbers but hardly anything about the variability of a set of numbers. 2. On negatively skewed curves, the mean is lower than the median, which is lower than the mode. 3. The results of a norm group comparison test can do all of the following EXCEPT: 4. If Juan has scored a 53 on a test, wh...
-
COUN 6360 Week 5 Quiz - Question and Answers
- Exam (elaborations) • 3 pages • 2022
- $9.99
- + learn more
COUN 6360 Week 5 Quiz 1. The Buckley Amendment, otherwise known as FERPA, asserted: 2. One problem with parallel forms reliability is that individuals may look up questions between the time they take the two tests. 3. In assessing the validity of a test, you randomly assign 100 individuals to two groups: one group assesses intelligence through a newly developed test, and a second group assesses intelligence through a traditional intelligence test that has been shown to be valid. You then cond...
-
COUN-6360-23-Assessment in Counseling-2021-Winter-QTR-Term-wks-1-thru-10 Week 6 Quiz
- Exam (elaborations) • 3 pages • 2022
- $9.99
- + learn more
COUN-6360-23-Assessment in Counseling-2021-Winter-QTR-Term-wks-1-thru-10 Week 6 Quiz 1. Histograms and frequency polygons are visual representations of frequency distributions. 2. Jerome has scored a 10 on a test. How has he done? 3. The results of a norm group comparison test can do all of the following EXCEPT: 4. On negatively skewed curves, the mean is lower than the median, which is lower than the mode. 5. On a normally distributed curve, which is true? 6. Measures of central tendency...
-
COUN 6360 Discussions Week 1, 6, 7, 8, 9, 11 (Bundle)
- Package deal • 7 items • 2022
- $60.48
- + learn more
COUN 6360 Discussions Week 1, 6, 7, 8, 9, 11 (Bundle)
-
COUN 6360 Discussion Questions Week 1, 7, 8,9 and 11
- Package deal • 5 items • 2022
- $63.45
- + learn more
COUN 6360 Week 1 Discussion; Informal Observations and Interpretations COUN 6360 Week 7 Discussion; Case Study and Assessments from COUN 6360 Week 8 Discussion; Mini Mental State Exam COUN 6360 Week 9 Discussion; Selecting Assessments COUN 6360 Week 11 Discussion; Using Assessments for Positive Social Change


