STAT 200 Study guides, Class notes & Summaries
Looking for the best study guides, study notes and summaries about STAT 200? On this page you'll find 51 study documents about STAT 200.
Page 4 out of 51 results
Sort by
-
STAT 200 STAT200 Week 6 Homework completed with Accurate Solutions
- Exam (elaborations) • 4 pages • 2022
- $10.60
- + learn more
STAT 200 STAT200 Week 6 Homework
-
STAT 200 Week 2 Homework Problems completed with Accurate solutions
- Exam (elaborations) • 5 pages • 2022
- $13.00
- + learn more
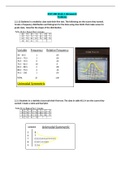
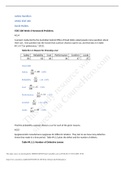
STAT 200 Week 2 Homework Problems completed with Accurate solutions. STAT 200 Week 2 Homework Problems 2.2.13 Students in a statistics class took their first test. The following are the scores they earned. Create a frequency distribution and histogram for the data using class limits that make sense for grade data. Describe the shape of the distribution. 2.3.1 Students in a statistics class took their first test. The data in table #2.3.4 are the scores they earned. Create a...
-
Stat 200 Midterm Exam Spring 1 2021
- Exam (elaborations) • 12 pages • 2022
- $10.00
- + learn more
Stat 200 Midterm Exam Spring 1 2021
-
STAT 200 STAT200 MIDTERM EXAM ANSWERS - UMUC (all solutions 100% correct) | UMUC STAT 200 Midterm Exam Answers
- Exam (elaborations) • 13 pages • 2022
- $13.49
- + learn more
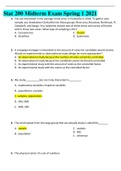
STAT 200 STAT200 MIDTERM EXAM ANSWERS - UMUC (all solutions 100% correct) | UMUC STAT 200 Midterm Exam Answers STAT 200 STAT200 MIDTERM EXAM ANSWERS - UMUC (all solutions 100% correct) | UMUC STAT 200 Midterm Exam Answers Stat 200 Midterm Exam Spring 1 1. You are interested in the average home price in Clarksville in 2018. To gather your sample, you breakdown Clarksville into these groups: River area, Rossview, Northeast, Ft. Campbell, and Sango. You randomly ch...
-
University of Maryland University College STAT200 - Assignment #1: Descriptive Statistics Data Analysis Plan GRADED 100% CORRECT
- Other • 4 pages • 2022
- $12.99
- + learn more
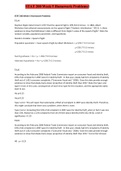
Scenario: The head of house hold is 42 years old, married, has two children, and has an Associate’s degree. The individual has annual household income of $78,723, a family size of 4, spends $7,800 on food, $17,628 on housing and $1992 on electricity. Use Table 1 to report the variables selected for this assignment. Note: The information for the required variable, “Income,” has already been completed and can be used as a guide for completing information on the remaining variables. Tab...

As you read this, a fellow student has made another $4.70

-
STAT 200: Introduction to Statistics Homework #5 Solutions
- Exam (elaborations) • 12 pages • 2022
- $13.39
- + learn more
. (3 points): Stephen Stigler determined in 1977 that the speed of light is 299,710.5 km/sec. In 1882, Albert Michelson had collected measurements on the speed of light ("Student t-distribution," 2013). Is there evidence to show that Michelson’s data is different from Stigler’s value of the speed of light? a.) State the random variable For this problem, the random variable will be: x = speed of light measured by Albert Michelson b.) State the population parameter The population parameter w...
-
STAT 200 Week 5 Homework Problems
- Exam (elaborations) • 5 pages • 2022
- $14.99
- + learn more
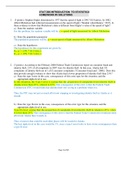
STAT 200 Week 5 Homework Problems 7.1.4 Stephen Stigler determined in 1977 that the speed of light is 299,710.5 km/sec. In 1882, Albert Michelson had collected measurements on the speed of light ("Student t-distribution," 2013). Is there evidence to show that Michelson’s data is different from Stigler’s value of the speed of light? State the random variable, population parameter, and hypotheses. Random Variable = Speed of light. Population parameter = mean speed of light by Albert M...
-
STAT 200; Week 7 Homework Problems, Rated A+
- Exam (elaborations) • 13 pages • 2021
- $13.49
- + learn more
STAT 200; Week 7 Homework Problems, Rated A+
-
STAT 200 Week 3 Homework Problems.
- Exam (elaborations) • 6 pages • 2021
- $9.49
- + learn more
STAT 200 Week 3 Homework Problems.
-
STAT 200 Week 3 Homework Problems latest update
- Exam (elaborations) • 6 pages • 2021
- $10.49
- + learn more
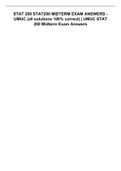
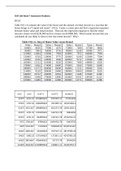
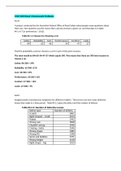
A project conducted by the Australian Federal Office of Road Safety asked people many questions about their cars. One question was the reason that a person chooses a given car, and that data is in table #4.1.4 ("Car preferences," 2013). Table #4.1.4: Reason for Choosing a Car Safety Reliability Cost Performance Comfort Looks 84 62 46 34 47 27 Find the probability a person chooses a car for each of the given reasons. The total would be 84+62+34+47+27 which equals 300. This means that t...
