Improve your search results. Select your educational institution and subject so that we can show you the most relevant documents and help you in the best way possible.
Ok, I understand!
Your school or university
Improve your search results. Select your educational institution and subject so that we can show you the most relevant documents and help you in the best way possible.
Here are the best resources to pass MAT 210. Find MAT 210 study guides, notes, assignments, and much more.
Page 2 out of
21 results
Sort by
MAT 210 Unit 4 Milestone 4 (1
Exam (elaborations) • 16
pages
• 2024
15 questions were answered correctly.
3 questions were answered incorrectly.
1
For this scatterplot, the r2 value was calculated to be 0.9382.
Which of the following set of statements is true?
● About 94% of the variation in beach visitors is explained by a negative linear
relationship with daily temperatures.
● The correlation coefficient, r, is 0.969.
● About 94% of the variation in beach visitors can be explained by a positive linear
relationship with daily temperature.
● Th...
MAT 210 Unit 4 Milestone 4 (1
Last document update:
ago
15 questions were answered correctly.
3 questions were answered incorrectly.
1
For this scatterplot, the r2 value was calculated to be 0.9382.
Which of the following set of statements is true?
● About 94% of the variation in beach visitors is explained by a negative linear
relationship with daily temperatures.
● The correlation coefficient, r, is 0.969.
● About 94% of the variation in beach visitors can be explained by a positive linear
relationship with daily temperature.
● Th...
MAT 210 Unit 5 Milestone 5 Exam Questions with All Correct Answers
Exam (elaborations) • 23
pages
• 2024
You passed this Milestone
22 questions were answered correctly.
2 questions were answered incorrectly.
1
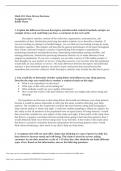
Adam tabulated the values for the average speeds on each day of his road trip as 60.5,
63.2, 54.7, 51.6, 72.3, 70.7, 67.2, and 65.4 mph. He wishes to construct a 98%
confidence interval.
What value of t* should Adam use to construct the confidence interval? Answer choices
are rounded to the thousandths place.
● 2.517
● 2.896
● 2.998
● 4.489
RATIONALE
Recall that we have ...
MAT 210 Unit 5 Milestone 5 Exam Questions with All Correct Answers
Last document update:
ago
You passed this Milestone
22 questions were answered correctly.
2 questions were answered incorrectly.
1
Adam tabulated the values for the average speeds on each day of his road trip as 60.5,
63.2, 54.7, 51.6, 72.3, 70.7, 67.2, and 65.4 mph. He wishes to construct a 98%
confidence interval.
What value of t* should Adam use to construct the confidence interval? Answer choices
are rounded to the thousandths place.
● 2.517
● 2.896
● 2.998
● 4.489
RATIONALE
Recall that we have ...
MAT 210 Unit 5 Milestone 5 Exam Questions with All Correct Answers
Exam (elaborations) • 23
pages
• 2024
You passed this Milestone
22 questions were answered correctly.
2 questions were answered incorrectly.
1
Adam tabulated the values for the average speeds on each day of his road trip as 60.5,
63.2, 54.7, 51.6, 72.3, 70.7, 67.2, and 65.4 mph. He wishes to construct a 98%
confidence interval.
What value of t* should Adam use to construct the confidence interval? Answer choices
are rounded to the thousandths place.
● 2.517
● 2.896
● 2.998
● 4.489
RATIONALE
Recall that we have ...
MAT 210 Unit 5 Milestone 5 Exam Questions with All Correct Answers
Last document update:
ago
You passed this Milestone
22 questions were answered correctly.
2 questions were answered incorrectly.
1
Adam tabulated the values for the average speeds on each day of his road trip as 60.5,
63.2, 54.7, 51.6, 72.3, 70.7, 67.2, and 65.4 mph. He wishes to construct a 98%
confidence interval.
What value of t* should Adam use to construct the confidence interval? Answer choices
are rounded to the thousandths place.
● 2.517
● 2.896
● 2.998
● 4.489
RATIONALE
Recall that we have ...
MAT 210 Week 3 Assignment 1: The Foundation of Data-Driven Decisions
Exam (elaborations) • 4
pages
• 2024
Assignment 1: The Foundation of Data-Driven Decisions Khanal 2
1. Explain the difference between descriptive and inferential statistical methods and give an example
of how each could help you draw a conclusion in the real world.
The key difference between descriptive and inferential statistics is the process and how the statistic for a
particular group is being studied and the conclusive evidence provided through the study. An example of
a real-world application would be a study that descri...
MAT 210 Week 3 Assignment 1: The Foundation of Data-Driven Decisions
Last document update:
ago
Assignment 1: The Foundation of Data-Driven Decisions Khanal 2
1. Explain the difference between descriptive and inferential statistical methods and give an example
of how each could help you draw a conclusion in the real world.
The key difference between descriptive and inferential statistics is the process and how the statistic for a
particular group is being studied and the conclusive evidence provided through the study. An example of
a real-world application would be a study that descri...
MAT 210 Week 3 Assignment 1: The Foundation of Data-Driven Decisions
Exam (elaborations) • 4
pages
• 2024
Assignment 1: The Foundation of Data-Driven Decisions Khanal 2
1. Explain the difference between descriptive and inferential statistical methods and give an example
of how each could help you draw a conclusion in the real world.
The key difference between descriptive and inferential statistics is the process and how the statistic for a
particular group is being studied and the conclusive evidence provided through the study. An example of
a real-world application would be a study that descri...
MAT 210 Week 3 Assignment 1: The Foundation of Data-Driven Decisions
Last document update:
ago
Assignment 1: The Foundation of Data-Driven Decisions Khanal 2
1. Explain the difference between descriptive and inferential statistical methods and give an example
of how each could help you draw a conclusion in the real world.
The key difference between descriptive and inferential statistics is the process and how the statistic for a
particular group is being studied and the conclusive evidence provided through the study. An example of
a real-world application would be a study that descri...
MAT 210 Unit 5 Milestone 5 22 questions were answered correctly. 2 questions were answered incorrectly.
Exam (elaborations) • 23
pages
• 2024
Adam tabulated the values for the average speeds on each day of his road trip as 60.5,
63.2, 54.7, 51.6, 72.3, 70.7, 67.2, and 65.4 mph. He wishes to construct a 98%
confidence interval.
What value of t* should Adam use to construct the confidence interval? Answer choices
are rounded to the thousandths place.
● 2.517
● 2.896
● 2.998
● 4.489
RATIONALE
Recall that we have n = 8, so the df = n-1 = 7. So if we go to the
row where df = 7 and then 0.01 for the tail probability, this...
MAT 210 Unit 5 Milestone 5 22 questions were answered correctly. 2 questions were answered incorrectly.
Last document update:
ago
Adam tabulated the values for the average speeds on each day of his road trip as 60.5,
63.2, 54.7, 51.6, 72.3, 70.7, 67.2, and 65.4 mph. He wishes to construct a 98%
confidence interval.
What value of t* should Adam use to construct the confidence interval? Answer choices
are rounded to the thousandths place.
● 2.517
● 2.896
● 2.998
● 4.489
RATIONALE
Recall that we have n = 8, so the df = n-1 = 7. So if we go to the
row where df = 7 and then 0.01 for the tail probability, this...
15 questions were answered correctly.
3 questions were answered incorrectly.
1
For this scatterplot, the r2 value was calculated to be 0.9382.
Which of the following set of statements is true?
● About 94% of the variation in beach visitors is explained by a negative linear
relationship with daily temperatures.
● The correlation coefficient, r, is 0.969.
● About 94% of the variation in beach visitors can be explained by a positive linear
relationship with daily temperature.
● Th...
MAT 210 Unit 4 Milestone 4 (1).
Last document update:
ago
15 questions were answered correctly.
3 questions were answered incorrectly.
1
For this scatterplot, the r2 value was calculated to be 0.9382.
Which of the following set of statements is true?
● About 94% of the variation in beach visitors is explained by a negative linear
relationship with daily temperatures.
● The correlation coefficient, r, is 0.969.
● About 94% of the variation in beach visitors can be explained by a positive linear
relationship with daily temperature.
● Th...
MAT 210 Unit 5 Milestone 5 QUESTIONS AND CORRECT DETAILED ANSWERS WITH RATIONALES VERIFIED ANSWERS ALREADY GRADED A+.
Case • 23
pages
• 2024
Adam tabulated the values for the average speeds on each day of his road trip as 60.5,
63.2, 54.7, 51.6, 72.3, 70.7, 67.2, and 65.4 mph. He wishes to construct a 98%
confidence interval.
What value of t* should Adam use to construct the confidence interval? Answer choices
are rounded to the thousandths place.
● 2.517
● 2.896
● 2.998
● 4.489
RATIONALE
Recall that we have n = 8, so the df = n-1 = 7. So if we go to the
row where df = 7 and then 0.01 for the tail probability, this...
MAT 210 Unit 5 Milestone 5 QUESTIONS AND CORRECT DETAILED ANSWERS WITH RATIONALES VERIFIED ANSWERS ALREADY GRADED A+.
Last document update:
ago
Adam tabulated the values for the average speeds on each day of his road trip as 60.5,
63.2, 54.7, 51.6, 72.3, 70.7, 67.2, and 65.4 mph. He wishes to construct a 98%
confidence interval.
What value of t* should Adam use to construct the confidence interval? Answer choices
are rounded to the thousandths place.
● 2.517
● 2.896
● 2.998
● 4.489
RATIONALE
Recall that we have n = 8, so the df = n-1 = 7. So if we go to the
row where df = 7 and then 0.01 for the tail probability, this...
MAT 210 Assingment 1 QUESTIONS AND CORRECT DETAILED ANSWERS WITH RATIONALES VERIFIED ANSWERS ALREADY GRADED A+.
Exam (elaborations) • 4
pages
• 2024
1. Explain the difference between descriptive and inferential statistical methods and give an example
of how each could help you draw a conclusion in the real world.
The key difference between descriptive and inferential statistics is the process and how the statistic for a
particular group is being studied and the conclusive evidence provided through the study. An example of
a real-world application would be a study that describes test scores in a particular class, and a graph that
shows t...
MAT 210 Assingment 1 QUESTIONS AND CORRECT DETAILED ANSWERS WITH RATIONALES VERIFIED ANSWERS ALREADY GRADED A+.
Last document update:
ago
1. Explain the difference between descriptive and inferential statistical methods and give an example
of how each could help you draw a conclusion in the real world.
The key difference between descriptive and inferential statistics is the process and how the statistic for a
particular group is being studied and the conclusive evidence provided through the study. An example of
a real-world application would be a study that describes test scores in a particular class, and a graph that
shows t...
MAT 210 MAT210_Assignment1 QUESTIONS AND CORRECT DETAILED ANSWERS WITH RATIONALES VERIFIED ANSWERS ALREADY GRADED A+.
Exam (elaborations) • 3
pages
• 2024
1. Explain the difference between descriptive and inferential statistical methods and give an
example of how each could help you draw a conclusion in the real world.
Descriptive statistics consists of the collection, organization, summarization, and
presentation of data. Statisticians practicing descriptive statistics try to describe a situation. If
you are coaching or playing in a baseball league, you can find out your batting average by using
descriptive statistics. This number will descr...
MAT 210 MAT210_Assignment1 QUESTIONS AND CORRECT DETAILED ANSWERS WITH RATIONALES VERIFIED ANSWERS ALREADY GRADED A+.
Last document update:
ago
1. Explain the difference between descriptive and inferential statistical methods and give an
example of how each could help you draw a conclusion in the real world.
Descriptive statistics consists of the collection, organization, summarization, and
presentation of data. Statisticians practicing descriptive statistics try to describe a situation. If
you are coaching or playing in a baseball league, you can find out your batting average by using
descriptive statistics. This number will descr...