Improve your search results. Select your educational institution and subject so that we can show you the most relevant documents and help you in the best way possible.
Ok, I understand!
Your school or university
Improve your search results. Select your educational institution and subject so that we can show you the most relevant documents and help you in the best way possible.
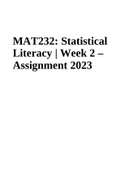
MAT 232: Statistical Literacy | Week 2 – Assignment 2023. State whether the data described below are discrete or continuous, and explain why.
The number of car accidents on a given stretch of highway each year
Choose the correct answer below.
A. The data are continuous because the data can only take on specific values.
B. The data are discrete because the data can only take on specific values.
C. The data are continuous because the data can take on any value in an interval .
D. The data ...
MAT 232: Statistical Literacy | Week 2 – Assignment 2023
Last document update:
ago
MAT 232: Statistical Literacy | Week 2 – Assignment 2023. State whether the data described below are discrete or continuous, and explain why.
The number of car accidents on a given stretch of highway each year
Choose the correct answer below.
A. The data are continuous because the data can only take on specific values.
B. The data are discrete because the data can only take on specific values.
C. The data are continuous because the data can take on any value in an interval .
D. The data ...
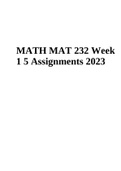
MAT 232 Week 1 5 Assignments 2023. In a survey of 1,001 people, 711(or 71%) said that they voted in a particular presidential election. The
margin of error for this survey was 4 percentage points. However, actual voting records show that only
61% of all eligible voters actually did vote. Does this imply that people lied when they responded in the
survey? Explain.
Choose the correct answer below.
B. Based on the survey, the actual percentage of voters is expected to be between 67%
and 75%, ...
MAT 232 Week 1 5 Assignments 2023
Last document update:
ago
MAT 232 Week 1 5 Assignments 2023. In a survey of 1,001 people, 711(or 71%) said that they voted in a particular presidential election. The
margin of error for this survey was 4 percentage points. However, actual voting records show that only
61% of all eligible voters actually did vote. Does this imply that people lied when they responded in the
survey? Explain.
Choose the correct answer below.
B. Based on the survey, the actual percentage of voters is expected to be between 67%
and 75%, ...
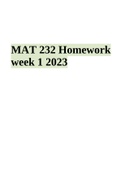
MAT 232 Homework week 1 2023 - Statistical Literacy. Forty adult men in the United States are randomly selected and measured for their body mass
index (BMI). Based on that sample, it is estimated that the average (mean) BMI for men is 25.5
with a margin of error of 3.2
Use the given statistic and margin of error to identify the range of values (confidence interval) likely to
contain the true value of the population parameter.
The range of values likely to contain the population parameter is...
MAT 232 Homework week 1 2023 - Statistical Literacy
Last document update:
ago
MAT 232 Homework week 1 2023 - Statistical Literacy. Forty adult men in the United States are randomly selected and measured for their body mass
index (BMI). Based on that sample, it is estimated that the average (mean) BMI for men is 25.5
with a margin of error of 3.2
Use the given statistic and margin of error to identify the range of values (confidence interval) likely to
contain the true value of the population parameter.
The range of values likely to contain the population parameter is...
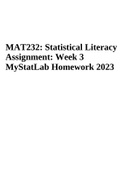
MAT 232: Statistical Literacy Assignment: Week 3 MyStatLab Homework 2023. Find the mean area and median area for these states.
The mean is square miles.
(Round to the nearest integer as needed.)
The median is square miles.
b. Which state is an outlier on the high end? If you eliminate
this state, what are the new mean and median areas for this
data set?
State 2 is an outlier on the high end.
The new mean is 81617 square miles.
(Round to the nearest integer as needed.)
The new median ...
MAT 232: Statistical Literacy Assignment: Week 3 MyStatLab Homework 2023
Last document update:
ago
MAT 232: Statistical Literacy Assignment: Week 3 MyStatLab Homework 2023. Find the mean area and median area for these states.
The mean is square miles.
(Round to the nearest integer as needed.)
The median is square miles.
b. Which state is an outlier on the high end? If you eliminate
this state, what are the new mean and median areas for this
data set?
State 2 is an outlier on the high end.
The new mean is 81617 square miles.
(Round to the nearest integer as needed.)
The new median ...
How much did you already spend on Stuvia? Imagine there are plenty more of you out there paying for study notes, but this time YOU are the seller. Ka-ching!
MAT 232 Midterm Exam 2023. Statistical Literacy. What is a population parameter?
A. A population parameter is a numerical value describing some attribute of a population.
B. A population parameter is a numerical value describing some attribute of a sample.
C. .A population parameter is a portion of the entities of interest that the researcher uses to
gather data.
D. D.A population parameter is a range of likely values that a sample statistic could take.
What is the difference between a sam...
MAT 232 Midterm Exam 2023
Last document update:
ago
MAT 232 Midterm Exam 2023. Statistical Literacy. What is a population parameter?
A. A population parameter is a numerical value describing some attribute of a population.
B. A population parameter is a numerical value describing some attribute of a sample.
C. .A population parameter is a portion of the entities of interest that the researcher uses to
gather data.
D. D.A population parameter is a range of likely values that a sample statistic could take.
What is the difference between a sam...
MAT 232: Statistical Literacy Week 5 Assignment 2023. For the following pair of variables, state whether you believe the two variables are correlated. If you believe they are
correlated, state whether the correlation is positive or negative. Explain your reasoning.
The IQ scores and hat sizes of randomly selected adults
Choose the correct answer below.
A. The variables are not correlated
B. Positive correlation because adults with larger hats tend to have higher IQs
C. Negative correlation...
MAT 232: Statistical Literacy Week 5 Assignment 2023
Last document update:
ago
MAT 232: Statistical Literacy Week 5 Assignment 2023. For the following pair of variables, state whether you believe the two variables are correlated. If you believe they are
correlated, state whether the correlation is positive or negative. Explain your reasoning.
The IQ scores and hat sizes of randomly selected adults
Choose the correct answer below.
A. The variables are not correlated
B. Positive correlation because adults with larger hats tend to have higher IQs
C. Negative correlation...
MAT 232 Week 4 Assignment Review 2023 - Statistical Literacy. A study was conducted that resulted in the following relative frequency
histogram. Determine whether or not the histogram indicates that a normal
distribution could be used as a model for the variable.
1,000 2,000 3,000 4,000 5,000
0
0.2
0.4
Calories Consumed per Day
Relative Frequency
Choose the correct answer below.
A.
as a model for the variable.
The histogram is not symmetric around a single peak and is not bell -shape...
MAT 232 Week 4 Assignment Review 2023 - Statistical Literacy
Last document update:
ago
MAT 232 Week 4 Assignment Review 2023 - Statistical Literacy. A study was conducted that resulted in the following relative frequency
histogram. Determine whether or not the histogram indicates that a normal
distribution could be used as a model for the variable.
1,000 2,000 3,000 4,000 5,000
0
0.2
0.4
Calories Consumed per Day
Relative Frequency
Choose the correct answer below.
A.
as a model for the variable.
The histogram is not symmetric around a single peak and is not bell -shape...
MAT 232 Week 1 Assignment 2023 - Statistical Literacy. Which of the following mathematical statements are true? Select all that apply.
A. 1 + 2 = 2
B. 1 + 1 = 2
C. 2 − 2 = 1
D. 1 • 1 = 1
E. 1 • 2 = 2
Did you notice? Questions like the one above use a square button for each choice, and you can choose multiple
answers from the list for each attempt.
Some questions require you to choose an answer from a dropdown list.
Click the dropdown list below to view the choices, and then c...
MAT 232 Week 1 Assignment 2023 - Statistical Literacy
Last document update:
ago
MAT 232 Week 1 Assignment 2023 - Statistical Literacy. Which of the following mathematical statements are true? Select all that apply.
A. 1 + 2 = 2
B. 1 + 1 = 2
C. 2 − 2 = 1
D. 1 • 1 = 1
E. 1 • 2 = 2
Did you notice? Questions like the one above use a square button for each choice, and you can choose multiple
answers from the list for each attempt.
Some questions require you to choose an answer from a dropdown list.
Click the dropdown list below to view the choices, and then c...
MAT232 Week 4 Assignment 2023 | Statistical Literacy. Use the normal distribution of IQ scores, which has a mean of and a standard deviation of , and the following table
with the standard scores and percentiles for a normal distribution to find the indicated quantity.
110 12
Click the icon to view the table. 1
Percentage of scores less than 122 is 84.13 %.
(Round to two decimal places as needed.)
Standard Scores and Percentiles for a Normal Distribution
(cumulative values from the left)
...
MAT232 Week 4 Assignment 2023 | Statistical Literacy
Last document update:
ago
MAT232 Week 4 Assignment 2023 | Statistical Literacy. Use the normal distribution of IQ scores, which has a mean of and a standard deviation of , and the following table
with the standard scores and percentiles for a normal distribution to find the indicated quantity.
110 12
Click the icon to view the table. 1
Percentage of scores less than 122 is 84.13 %.
(Round to two decimal places as needed.)
Standard Scores and Percentiles for a Normal Distribution
(cumulative values from the left)
...
Want to regain your expenses?
How much did you already spend on Stuvia? Imagine there are plenty more of you out there paying for study notes, but this time YOU are the seller. Ka-ching!
Discover all about earning on Stuvia