Boxplot Study guides, Class notes & Summaries
Looking for the best study guides, study notes and summaries about Boxplot? On this page you'll find 300 study documents about Boxplot.
Page 4 out of 300 results
Sort by
-
Afgerond met een 9. Inleiding Onderzoek uitgebreide aantekeningen
- Class notes • 43 pages • 2021
- $7.70
- 158x sold
- + learn more
Ik heb het vak afgerond met een 9. Uitgebreide aantekeningen van het vak Inleiding Onderzoek.
-
MATH 302| STATISTICS| MIDTERM EXAM WITH CORRECT ANSWERS 2024| GRADED A
- Exam (elaborations) • 10 pages • 2024
- $11.49
- + learn more
MATH 302| STATISTICS| MIDTERM EXAM WITH CORRECT ANSWERS 2024| GRADED A Part 1 of 9 - Question 1 of 25 1.0 Points For a boxplot, the vertical line inside the box indicates the location of the • A. mean • B. median • C. inter quartile range • D. mode Part 2 of 9 -
-
Stat 500 MIDTERM EXAM QUESTIONS AND CORRECT ANSWERS 2023.
- Exam (elaborations) • 6 pages • 2023
- $10.49
- + learn more
Stat 500 MIDTERM EXAM QUESTIONS AND CORRECT ANSWERS 2023. Name:_ SOLUTIONS (8 questions) YOU HAVE 3 HOURS TO COMPLETE THIS. Show all work. Just showing answer without calculations may result in a zero for that question. 1. A water-heater manufacturer guarantees the electric heating element for a period of five years. The lifetimes, in months, for a sample of 10 such elements are as follows. 49.3 79.3 186.4 68.4 62.6 65.1 53.2 32.3 40.1 29.3 A. (10 points) Using the methods we learned ...
-
Seeing Through Statistics 4th Edition by Utts - Test Bank
- Exam (elaborations) • 196 pages • 2023
- $23.85
- + learn more
CHAPTER 3 MEASUREMENTS, MISTAKES, AND MISUNDERSTANDINGS SECTION 3.1 SIMPLE MEASURES DON’T EXIST FREE RESPONSE QUESTIONS 1. Explain why even the simplest kind of measurement, such as finding your height, still presents complicated issues. ANSWER: ANY REASONABLE ANSWER OK. EXAMPLES: THE ACCURACY OF YOUR MEASUREMENT DEPENDS ON YOUR MEASUREMENT TOOL; HOW TALL YOU STAND WHEN YOU MEASURE; WHETHER OR NOT YOU WEAR SHOES, ETC. 2. Describe one of the issues that you would need to think about when...
-
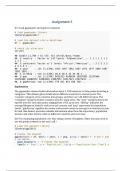
Building_Layered_Visualizations_VisualAnalytics_Week6_NEC_Solved
- Exam (elaborations) • 16 pages • 2023
- $10.49
- + learn more
1. get the structure of the gss_sm dataframe. What is the data type of race, sex, region and income? What do the levels refer to? 2. create a graph that shows a count of religious preferences grouped by region 3. turn the region counts in percentages 4. use dodge2() to put the religious affiliations side by side within regions 5. show the religious preferences by region, faceted version with the coordinate system swapped 6. using pipes show a 10 random instances of the first six columns in...

Want to regain your expenses?

-
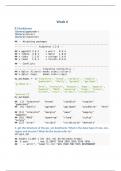
Information_Visualization_Week5_NEC_Solved
- Exam (elaborations) • 9 pages • 2023
- $9.99
- + learn more
Experiment with the gapminder data to practice some of the new geoms we have learned. Try examining population or life expectancy over time using a series of boxplots. (Hint: you may need to use the group aesthetic in the aes() call.) Can you facet this boxplot by continent? Is anything different if you create a tibble from gapminder that explicitly groups the data by year and continent first, and then create your plots with that? Comment your code line by line. Explain what your charts are show...
-
Probability and Statistics, WGU C955 | 51 Questions and answers with 100% correct solutions | Graded A+
- Exam (elaborations) • 6 pages • 2024
- $12.48
- + learn more
Boxplot an image that has min, Q1, median, Q3, max Histogram A graphical representation -- bars, measuring the frequency within each interval Skewed right Not a symmetric distribution, the tail is on the right, i.e. extra stuff on the right Measures of center Median, the mean (and mode) Measures of spread Range, IQR & standard deviation Standard Deviation Rule 68% of the data are within 1 standard deviation, 95% are within 2, 99.7 are within 3 standard deviations from the mean. For skewed...
-
WGU Intro to Probability and Statistics Questions & Answers 100% Correct!!
- Exam (elaborations) • 11 pages • 2023
- $11.99
- + learn more
Population - ANSWER-The entire group that is the target of interest, not just people. Eg, "the population of 1 bedroom apartments" Sample - ANSWER-A subgroup of the population. Eg, "the 1 bedroom apartments with dishwashers." Steps in the statistics process - ANSWER-1. PRODUCE DATA (by studying a sample of the population) 2. EXPLORATORY DATA ANALYSIS (Summarize data.) 3. PROBABILITY ANALYSIS (Determine how the sample may differ from the population.) 4. INFERENCE (draw conclusions) ...
-
WGU C955 Probability and Statistics Exam Questions & Answers Correct 100%
- Exam (elaborations) • 5 pages • 2024
- $10.49
- + learn more
Boxplot - Answer an image that has min, Q1, median, Q3, max Histogram - Answer A graphical representation -- bars, measuring the frequency within each interval Skewed right - Answer Not a symmetric distribution, the tail is on the right, i.e. extra stuff on the right Measures of center - Answer Median, the mean (and mode) Measures of spread - Answer Range, IQR & standard deviation Standard Deviation Rule - Answer 68% of the data are within 1 standard deviation, 95% are within 2, 9...
-
Samenvatting hoofdstuk 1 MM&C, onderzoekspracticum 1
- Summary • 7 pages • 2024
- $3.85
- + learn more
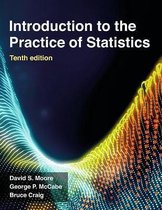
Dit is een samenvatting van hoofdstuk 1 (LET OP: alleen 1.2, 1.3 en 1.4 is hierin verwerkt, omdat 1.1 geen onderdeel is van de tentamenstof) uit het boek Introduction to the Practice of Statistics voor het vak onderzoekspracticum 1. Hierin komen de meest voorkomende grafieken aan bod (histogram, cirkeldiagram, staafdiagram, boxplot, steel-bladdiagram, etc.) en er wordt uitleg gegeven over de centrum- en spreidingsmaten. Er zijn veel plaatjes aan toegevoegd, zodat de tekst duidelijker is.
