Boxplot Study guides, Class notes & Summaries
Looking for the best study guides, study notes and summaries about Boxplot? On this page you'll find 300 study documents about Boxplot.
Page 2 out of 300 results
Sort by
-
Psychologie UU - TOE: Grasple lessen vaardighedentoets Correlationeel en Experimenteel, SPSS en JASP (behaald met een 10)
- Summary • 18 pages • 2023
- $6.61
- 1x sold
- + learn more
In deze samenvatting vind je alle aantekeningen van de Grasple lessen voor Correlationeel 1 en 2 & Experimenteel 1 en 2, voor de vaardighedentoets van TOE in SPSS en JASP. Ik heb de vaardighedentoets gehaald met een 10.
-
WGU C955 Formulas and Terms (Latest 2023/ 2024 Update) Applied Probability and Statistics | Questions and Verified Answers| 100% Correct
- Exam (elaborations) • 55 pages • 2023
- $11.49
- + learn more
WGU C955 Formulas and Terms (Latest 2023/ 2024 Update) Applied Probability and Statistics | Questions and Verified Answers| 100% Correct Q: Simpsons Paradox A counterintuitive situation that occurs when a result that appears in individual groups of data disappears or reverses when the groups are combined. Can only occur when the sizes of the groups are inconsistent Q: Lurking Variables : Answer: • A lurking variable is a variable not included in the study, but affects the varia...
-
Samenvatting cursus SPSS
- Summary • 7 pages • 2023
- $4.95
- 1x sold
- + learn more
Deze samenvatting is bedoeld voor studenten die de opleiding Pedagogische Wetenschappen volgen aan Universiteit Leiden en in het 1e leerjaar zitten. Het bevat alle nodige informatie die gebruikt mag worden tijdens het tentamen.
-
Summary BBS1003 Statistics course
- Summary • 16 pages • 2023
- $8.14
- 4x sold
- + learn more
This is a clear summary about the BBS1003 Statistics course. it contains all the relevant topics and formula's that is needed for the exam including the information from the lectures.
-
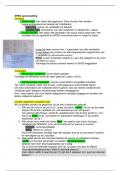
WGU C955 PROBABILITY AND STATISTICS
- Exam (elaborations) • 4 pages • 2023
- $10.49
- + learn more
Boxplot - Answer- an image that has min, Q1, median, Q3, max Histogram - Answer- A graphical representation -- bars, measuring the frequency within each interval Skewed right - Answer- Not a symmetric distribution, the tail is on the right, i.e. extra stuff on the right Measures of center - Answer- Median, the mean (and mode) Measures of spread - Answer- Range, IQR & standard deviation Standard Deviation Rule - Answer- 68% of the data are within 1 standard deviation,

Make study stress less painful

-
Probability and Statistics, WGU C955 Questions and Answers (Graded A)
- Exam (elaborations) • 4 pages • 2023
- $10.99
- + learn more
Probability and Statistics, WGU C955 Questions and Answers (Graded A) Probability and Statistics, WGU C955 Questions and Answers (Graded A) Probability and Statistics, WGU C955 Questions and Answers (Graded A)Boxplot - ANSWER-an image that has min, Q1, median, Q3, max Histogram - ANSWER-A graphical representation -- bars, measuring the frequency within each interval Skewed right - ANSWER-Not a symmetric distribution, the tail is on the right, i.e. extra stuff on the right Meas...

-
MATH302 Week 2 Test
- Other • 19 pages • 2023
- $35.99
- + learn more
1. Question: An instructor wants to compare spread (variation) of final grades of students in her online class and face-to-face class. The instructor selects 10 students randomly from each class and the following table shows the final grades of those students. See Attached Excel for Data. 2. Question: The lengths (in kilometers) of rivers on the South Island of New Zealand that flow to the Tasman Sea are listed below. Find the variance. See Attached Excel for Data. Use the Excel function to fin...
-
AP Statistics Final Exam Review 2023-2024 Questions With Complete Solutions
- Exam (elaborations) • 9 pages • 2023
- $10.99
- + learn more
Categorical Data correct answer: Assigns a unique value for each case, used to name or identify it Quantitative Data correct answer: A variable in which the numbers act as a numerical value, always have units Stem and leaf plot correct answer: Shows quantitative data values in a way that sketches the distribution of the data Ogive correct answer: a graph that represents the cumulative frequencies for the classes in a frequency distribution Histogram correct answer: Bar graphing ...
-
MCQ STATS FINAL EXAMQUESTIONS AND ANSWERS
- Exam (elaborations) • 8 pages • 2023
- $8.49
- + learn more
MCQ STATS FINAL EXAMQUESTIONS AND ANSWERS Researchers conducted a telephone survey of 427 adults living in a large city. The adults were asked whether they planned to purchase a smart watch in the next year. The table shows the responses categorized by the region of the city in which the residents live. *table* Which of the following graphical displays is most appropriate for preparing the proportions of those surveyed who plan to purchase a smart watch within the four regions? A scien...
-
MATH302 Week 2 Test
- Exam (elaborations) • 19 pages • 2023
- $22.49
- + learn more
1. Question: An instructor wants to compare spread (variation) of final grades of students in her online class and face-to-face class. The instructor selects 10 students randomly from each class and the following table shows the final grades of those students. See Attached Excel for Data. 2. Question: The lengths (in kilometers) of rivers on the South Island of New Zealand that flow to the Tasman Sea are listed below. Find the variance. See Attached Excel for Data. Use the Excel function to fin...
