
MATH 225N MATH (MATH 225N MATH)
Chamberlain College Of Nursing
Here are the best resources to pass MATH 225N MATH (MATH 225N MATH). Find MATH 225N MATH (MATH 225N MATH) study guides, notes, assignments, and much more.

Other
MATH 225N Week 4 Discussion, Probability (Graded A)
MATH 225N Week 4 Discussion, Probability (Graded A)-Consider when you are listening to a new patient who says they have had a fever for 3 days. You would use your knowledge and experience … with probability to come to a diagnosis. What changes those probabilities? Is it age, is it other symptoms, is it new study results? What is the source of these probabilities and what causes these … probabilities to change? This discussion is not to debate diagnoses, but to focus on the sources and influe...
 ProfMiaKennedy
Other
MATH 225N Week 3 Discussion, Central Tendency and Variables(A+)
MATH 225N Week 3 Discussion, Central Tendency and Variables(A+)..MATH 225N Week 3 Discussion, Central Tendency & Variation Understanding descriptive statistics, their measures of center and their variability, helps form the foundation of statistical analysis. Descriptive statistics tell us how frequently an observation occurs, what is considered average, and how far … data in our sample deviate from being average. With these statistics, we are able to provide a summary of characteristics from...
ProfMiaKennedy
Exam (elaborations)
MATH 225N Week 3 Central Tendancy Question and Answers, Scored 100%
ProfMiaKennedy
Exam (elaborations)
Week 4 Math 225N Statistics Questions & Answers (Score 100%)
WEEK 4 MATH 225N STATISTICS QUESTIONS & ANSWERS (score 100%)Alice sells boxes of candy at the baseball game and wants to know the mean number of boxes she sells. The numbers for the games so far are listed below. 16,14,14,21,15 Find the mean boxes sold. Question 2 Given the following list of prices (in thousands of dollars) of randomly selected trucks at a car dealership, find the median. 20,46,19,14,42,26,33 Question 3 Each person in a group shuffles a deck of cards and keeps selecti...
ProfMiaKennedy

Exam (elaborations)
Week 6 Math 225N Statistics Questions & Answers (Score 100%)
WEEK 6 MATH 225N STATISTICS QUESTIONS & ANSWERS (score 100%)-A statistics professor recently graded final exams for students in her introductory statistics course. In a review of her grading, she found the mean score out of 100 points was a x¯=77, with a margin of error of 10. Construct a confidence interval for the mean score (out of 100 points) on the final exam. Answer: (67, 87) Question 2 A random sample of adults were asked whether they prefer reading an e-book over a printed boo...
ProfMiaKennedy

Exam (elaborations)
MATH 225N Week 1 Sampling Questions and Answers; 100% graded, 2021
MATH 225N Week 1 Sampling Questions and Answers; 100% graded, 2021-Assume that 80houses are present in the form of a grid consisting of 10 columns and 8 If a loud speaker is placed just before the first row, which sampling method works the best to select a sample of houses if we … want to get an estimate of the average loudness (measured in decibels) near all the 80 houses? Angela is studying the mean blood pressure of all students attending her college. She collects data from the … 38stud...
ProfMiaKennedy

Exam (elaborations)
MATH 225N Week 1 Evidence, Claims and Types - Questions & Answers (already graded)
MATH 225N Week 1 Evidence, Claims and Types - Questions & Answers (already graded)-A study is … to research the effects of drinking coffee on hours of sleep. Would an experimental or … observational study design more appropriate? A researcher is … in the effects of watching videos just before bed on the quality of sleep. Which of the following claims would … appropriate for this situation? Select only one answer choice. In a psychological study aimed at testing a medicine for reducing ...
ProfMiaKennedy

Exam (elaborations)
MATH 225N Week 1 Assignment, Variables and Measures of Data (solved) 2021
MATH 225N Week 1 Assignment, Variables and Measures of Data (solved) 2021-Which of the following best describes the term explanatory variable? Which of the following best describes the term qualitative? A zoologist measures the birthweight of each cub in a litter of lions. What is the level of … measurement of the data? Margaret is investigating if gender has any effect on political party associations. What is the response variable? Timothy is collecting data on number of dental cavities. ...
ProfMiaKennedy

Exam (elaborations)
MATH 225N Week 1 Assignment, Comparing Sampling Methods, Latest Questions & Answers already Graded (2021)
MATH 225N Week 1 Assignment, Comparing Sampling Methods, Latest Questions & Answers already Graded (2021)-A television station plans to send a crew to a polling center on an election day. Because they do not have time to interview … each individual voter, they decide to count voters leaving the polling location and ask every 20th voter for an interview. What type of sampling is this? In order to study the shoe sizes of people in his town, Billy samples the population by dividing the residents...
ProfMiaKennedy
Exam (elaborations)
MATH 225N Week 1 Assignment, Comparing Sampling Methods Q and A: 2019
A television station plans to send a crew to a polling center on an election day. Because they do not have time to interview … each individual voter, they decide to count voters leaving the polling location and ask every 20th voter for an interview. What type of sampling is this? In order to study the shoe sizes of people in his town, Billy samples the population by dividing the residents by age and randomly … selecting a proportionate number of residents from each age group. Which type of ...
 oassignment
Exam (elaborations)
MATH 225N Week 3 Central Tendancy Question and Answers,WELL EXPLAINED.
Given the following box-and-whisker plot, decide if the data is skewed or symmetrical. Which of the following frequency tables show a skewed data set? Select all answers that apply. Which of the following frequency tables show a skewed data set? Select all answers that apply. Which of the following frequency tables shows a skewed data set? Select all answers that apply. For the following dataset, you are interested to determine the “spread” of the data……Would you employ calculations ...
oassignment
Exam (elaborations)
Exam (elaborations) MATH 225N MATH
Compute the value of the test statistic (z-value) for a hypothesis test for one population mean with a known standard deviation Question Jamie, a bowler, claims that her bowling score is less than 168 points, on average. Several of her teammates do not believe her, so she decides to do a hypothesis test, at a 1% significance level, to persuade them. She bowls 17 games. The mean score of the sample games is 155 points. Jamie knows from experience that the standard deviation for her bowling sc...
 Fiona3
Other
Stats week 4
Probability is a measure that is associated with how certain we are of outcomes of a particular experiment or activity. An experiment is a planned operation carried out under controlled conditions. If the result is not predetermined, then the experiment is said to be a chance experiment. Flipping one fair coin twice is an example of an experiment. A result of an experiment is called an outcome. The sample space of an experiment is the set of all possible outcomes. Three ways to represent a sa...
Fiona3

Exam (elaborations)
MATH 225N Week 1 Assignment Sampling Methods – Questions and Answers
Question: Assume that 80houses are present in the form of a grid consisting of 10 columns and 8 If a loud speaker is placed just before the first row, which sampling method works the best to select a sample of houses if we want to get an estimate of the average loudness (measured in decibels) near all the 80 houses? Question: Angela is studying the mean blood pressure of all students attending her college. She collects data from the 38students in her statistics class. Which type of sampling is ...
oassignment

Package deal
MATH 225N Week 5 Bundle: Homework Assignments, Lab Assignment & A Grade Discussion
MATH 225N Week 5 Bundle: Homework Assignments, Lab Assignment & A Grade Discussion
ProfMiaKennedy
Other
MATH 225N Week 5 Problems with Screenshots
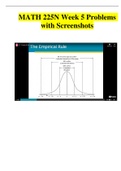
MATH 225N Week 5 Problems with Screenshots-A data set has mean of 4 and standard Deviation of 4. What is the probability that a randomly … data value is greater than 78? Question: After collecting the data, Peter finds that the standardized test scores of the students in a school are normally distributed with mean 85 points and standard deviation 3 points. Use the Empirical Rule to find the probability that a randomly … student’s score is greater than 76 points. Provide the final answer as...
ProfMiaKennedy
Other
MATH 225N Week 5 Lab Assignment (Version 2) Summer 2020/2021, complete solutions guide
MATH 225N Week 5 Lab Assignment (Version 2) Summer 2020/2021, complete solutions guide-Step 1: Survey or measure 10 people to find their heights. Determine the mean and standard deviation for this group by using the Week 3 Excel spreadsheet. Post a screen shot of the portion of the spreadsheet that helped you determine these values. How does your height compare to the mean (average) height of the group that you surveyed? Is your height taller, shorter, or the same as the mean of your group? Mea...
ProfMiaKennedy

Package deal
MATH 225N Week 7 Bundle: Homework Assignments, Lab Assignment, Discussion (A+ Solutions & Guide)
MATH 225N Week 7 Bundle: Homework Assignments, Lab Assignment, Discussion (A+ Solutions & Guide)
ProfMiaKennedy

Other
MATH 225N Week 7 Lab Assignment, Complete solution guide)
MATH 225N Week 7 Lab Assignment Complete solution guide) - Confidence Intervals CI) are basically the range of values we are fairly sure that our true values falls within. According to El-Masri, M. (2012), CI is one of the most dependable indicators of accurateness of our assumption. In week five, I gave the data for 10 nurses heights which was as follows: 60”, 68”, 66”, 65”, 65”. 67”, 63”, 65”, 68”, and 61”. I chose a convenience sample as I chose from 10 nurses in my workpl...
ProfMiaKennedy

Exam (elaborations)
Week 7 Assignment Hypothesis Test For The Mean-Polution Standard Deviation Known
WEEK 7 ASSIGNMENT HYPOTHESIS TEST FOR THE MEAN-POLUTION STANDARD DEVIATION KNOWN Jamie, a bowler, claims that her bowling score is less than 168 points, on average. Several of her teammates do not believe her, so she decides to do a hypothesis test, at a 1% significance level, to persuade them. She bowls 17 games. The mean score of the sample games is 155 points. Jamie knows from experience that the standard deviation for her bowling score is 19 points. •H0: μ≥168; Ha: μ<168 •α=0....
ProfMiaKennedy