
MATH 225N MATH (MATH 225N MATH)
Chamberlain College Of Nursing
Hier vind je de beste samenvattingen om te slagen voor MATH 225N MATH (MATH 225N MATH). Er zijn o.a. samenvattingen, aantekeningen en oefenvragen beschikbaar.
Tentamen (uitwerkingen)
Math 225N Week 6 Quiz Statistics – Question And Answers
Question 1 A statistics professor recently graded final exams for students in her introductory statistics course. In a review of her grading, she found the mean score out of 100 points was a x¯=77, with a margin of error of 10. Construct a confidence interval for the mean score (out of 100 points) on the final exam. That is correct! Answer: (67, 87) Question 2 A random sample of adults were asked whether they prefer reading an e-book over a printed book. The survey resulted in a sample proporti...
 NURSEEXAMITY

Tentamen (uitwerkingen)
Math 225N Week 1 Evidence, Claims, And Types Questions And Answers
PopulairMATH 225N Week 1 Evidence, Claims, and types Questions and Answers A study is … to research the effects of drinking coffee on hours of sleep. Would an experimental or … observational study design more appropriate? A researcher is … in the effects of watching videos just before bed on the quality of sleep. Which of the following claims would … appropriate for this situation? Select only one answer choice. In a psychological study aimed at testing a medicine for reducing stress levels, the...
 grademaster
Tentamen (uitwerkingen)
MATH 225N Week 2 Statistics Quiz – Question and Answers
MATH 225N Week 2 Statistics Quiz – Question and Answers
 brilliantsamrt1
Voordeelbundel
(Complete & Answered) MATH 225N Week 7 Bundle: Homework Assignments, Lab Assignment, Discussion
1 Exam (elaborations) MATH 225N Week 7 Assignment Conduct a Hypothesis Test for Proportion – P-Value Approach 2 OTHER MATH 225N Week 7 Assignment Hypothesis Testing Questions and Answers (Test Bank) 2023 3 Exam (elaborations) MATH 225N Week 7 Assignment: Hypothesis Test for the Mean – Population Standard Deviation Known (verified Answers 100% Cor
NURSEEXAMITY
Voordeelbundel
(Complete & Answered) MATH 225N Week 7 Bundle: Homework Assignments, Lab Assignment, Discussion
1 Exam (elaborations) MATH 225N Week 7 Assignment Conduct a Hypothesis Test for Proportion – P-Value Approach 2 OTHER MATH 225N Week 7 Assignment Hypothesis Testing Questions and Answers (Test Bank) 2023 3 Exam (elaborations) MATH 225N Week 7 Assignment: Hypothesis Test for the Mean – Population Standard Deviation Known (verified Answers 100% Cor
 BESTSELLERSTUVIA01
Samenvatting
Summary MATH 225N Week 7 Lab Assignment (Summer 2022/2023) Complete solution guide - Chamberlain.
Summary MATH 225N Week 7 Lab Assignment (Summer 2022/2023) Complete solution guide - Chamberlain.
BESTSELLERSTUVIA01
Samenvatting
Summary MATH 225N Week 7 Lab Assignment (Summer 2022/2023) Complete solution guide - Chamberlain.
Summary MATH 225N Week 7 Lab Assignment (Summer 2022/2023) Complete solution guide - Chamberlain.
NURSEEXAMITY
Overig
Week 4 discussion Probability latest 2023
Week 4 discussion Probability.
 Studygreatsolutions
Overig
MATH 225N MATH Week 1 Discussion Basic Statistics Data Used in Everyday Life.
Week 1 Discussion: basic statistics data used in everyday life According to Holmes, Illowsky, and Dean (2019), statistics are utilized by most of us on a daily basis. I have chosen to talk about the long-term effects of intentional weight loss on diabetes
Studygreatsolutions
Tentamen (uitwerkingen)
MATH 225N-Week 1 Assignment-Comparing Sampling Methods-With latest solutions-2023-2024
MATH 225N-Week 1 Assignment-Comparing Sampling Methods-With latest solutions-2023-2024
 Studybooth
Overig
Statistic Final All Solution 100% Correct Spring Fall- 2022 Latest Guaranteed Grade A+
1/1POINTS Afitnesscenterclaimsthathemeanamountoftimethatapersonspendsathegym pervisitis33 minutes.Identifythenulhypothesis,H0,andthealternative hypothesis,Ha,intermsoftheparameterμ. H0:μ≠33;Ha:μ=33 H0:μ=33;Ha:μ≠33 H0:μ≥33;Ha:μ<33 H0:μ≤33;Ha:μ>33 AnswerExplanation Corectanswer: H0:μ=33;Ha:μ≠33 Letheparameterμ beusedtorepresenthemean.Thenulhypothesisisalways statedwithsomeform ofequality:equal(=),greaterthanorequalto(≥),orlessthan orequalto(≤).Therefore,i...
 Allan100

Samenvatting
BEST Academic and Professional Success Plan Template GUIDE
Summary Syllabus
 DYNAMICSCORES

Tentamen (uitwerkingen)
Midterm NURS 6665 1-20 with answers 2022/2023 RATED 100% CORRECT
Questions And Answers
DYNAMICSCORES

Tentamen (uitwerkingen)
MATH 225N MATHWeek 7 Hypothesis Testing Questions and Answers.
MATH 225N MATHWeek 7 Hypothesis Testing Questions and Answers.
greatsolutions

Tentamen (uitwerkingen)
MATH 225N - Week 7 Hypothesis Testing. Questions and Answers. Complete Guide with Solutions.
Week 7 Hypothesis Testing Q & A 1. Steve listens to his favorite streaming music service when he works out. He wonders whether the service algorithm does a good job of finding random songs that he will like more often than not. To test this, he listens to 50 songs chosen by the service at random and finds that he likes 32 of them. Use Excel to test whether Steve will like a randomly selected song more than not and then draw a conclusion in the context of a problem. Use α = 0.05. Type equat...
greatsolutions

Samenvatting
Week 5 Assignment: Lab Summer 20121 Statistical Reasoning
Step 1: Survey or measure 10 people to find their heights. Determine the mean and standard deviation for this group by using the Week 3 Excel spreadsheet. Post a screen shot of the portion of the spreadsheet that helped you determine these values
greatsolutions
Overig
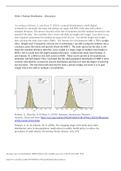
MATH 225N MATHWeek 5 Normal Distribution Discussion
Week 5 Normal Distribution – Discussion
greatsolutions

Tentamen (uitwerkingen)
Week 4 Probability Questions and answers. verified
1. Which of the pairs of events below is dependent? Select the correct answer below: drawing a 7 and then drawing another 7 with replacement from a standard deck of cards rolling a 1 and then rolling a 6 with a standard die rolling a 3 and then rolling a 4 with a standard die drawing a heart and then drawing a spade without replacement from a standard deck of cards
greatsolutions

Overig
Week 4 discussion Probability Complete Solution.
According to Holmes, A. and Dean, S. (2019), probability is a measure that is associated with how certain we are of
greatsolutions
Overig
Week 3 Discussion Central Tendency and Variables
According to Holmes, A., Illowsky, B. and Dean, S. (2019), central tendency is an average. It is the mean, mode, and median that represent the center of our data sets. Variation is just the opposite of central tendency. I
greatsolutions
Tentamen (uitwerkingen)
MATH 225N MATHWeek 2 Graphs Homework Help Questions and Answers.docx Week 2 Graphs Homework Help Questions and Answers.
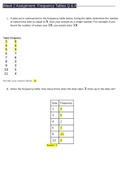
Week 2 Assignment: Frequency Tables Q & A 1. A data set is summarized in the frequency table below. Using the table, determine the number of values less than or equal to 5. Give your answer as a single number. For example if you found the number of values was 19, you would enter 19.
greatsolutions