Umuc stat 200 Study guides, Class notes & Summaries
Looking for the best study guides, study notes and summaries about Umuc stat 200? On this page you'll find 83 study documents about Umuc stat 200.
All 83 results
Sort by
-
STAT 200 Week 5 Homework Problems Denize_Shy. (Approach-3), University of Maryland University College (UMUC) 1) According to the February 2008 Federal Trade Commission report on consumer fraud and identity theft, 23% of all complaints in 2007 were for ide
- Exam (elaborations) • 7 pages • 2022
- $17.99
- + learn more
STAT 200 Week 5 Homework Problems Denize_Shy. (Approach-3), University of Maryland University College (UMUC) 1) According to the February 2008 Federal Trade Commission report on consumer fraud and identity theft, 23% of all complaints in 2007 were for identity theft. In that year, Alaska had 321 complaints of identity theft out of 1,432 consumer complaints ("Consumer fraud and," 2008). Does this data provide enough evidence to show that Alaska had a lower proportion of identity theft than 23%...
-
STAT 200 Week 4 Homework Problems Solutions, University of Maryland University College (UMUC) STAT 200 Week 4 Homework Problems 6.1.2 1.) The commuter trains on the Red Line for the Regional Transit Authority (RTA) in Cleveland, OH, have a waiting time du
- Exam (elaborations) • 5 pages • 2022
- $15.99
- + learn more
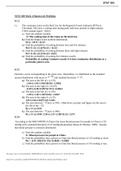
STAT 200 Week 4 Homework Problems Solutions, University of Maryland University College (UMUC) STAT 200 Week 4 Homework Problems 6.1.2 1.) The commuter trains on the Red Line for the Regional Transit Authority (RTA) in Cleveland, OH, have a waiting time during peak rush hour periods of eight minutes ("2012 annual report," 2012). a.) State the random variable. x=waiting time during peak hours b.) Find the height of this uniform distribution. 1/(8-0)=0.125 c.) Find the probability of waiting bet...
-
STAT 200 Assignment 3 Inferential Statistics Analysis and Writeup, University of Maryland University College (UMUC) Assignment #3: Inferential Statistics Analysis and Writeup Identifying Information Student (Full Name): Class: Stat 200 Instructor: Date: P
- Other • 4 pages • 2022
- $17.39
- + learn more
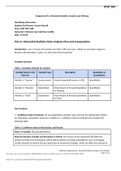
STAT 200 Assignment 3 Inferential Statistics Analysis and Writeup, University of Maryland University College (UMUC) Assignment #3: Inferential Statistics Analysis and Writeup Identifying Information Student (Full Name): Class: Stat 200 Instructor: Date: Part A: Inferential Statistics Data Analysis Plan and Computation Introduction: For this assignment, I have elected to establish a scenario of a 36 year old, married parent of three children. For the SE variables, in addition to income, I have i...
-
STAT 200 Week 3 Homework Problems Solutions, University of Maryland University College (UMUC) STAT 200 Week 3 Homework Problems 4.1.4 A project conducted by the Australian Federal Office of Road Safety asked people many questions about their cars. One que
- Package deal • 4 items • 2022
- $16.09
- + learn more
STAT 200 Week 3 Homework Problems Solutions, University of Maryland University College (UMUC) STAT 200 Week 3 Homework Problems 4.1.4 A project conducted by the Australian Federal Office of Road Safety asked people many questions about their cars. One question was the reason that a person chooses a given car, and that data is in table #4.1.4 ("Car
-
STAT 200 STAT200 MIDTERM EXAM ANSWERS (2021) - UMUC (all solutions 100% correct) | UMUC STAT 200 Midterm Exam Answers (2021)
- Exam (elaborations) • 12 pages • 2021
- $20.49
- 1x sold
- + learn more
Stat 200 Midterm Exam Spring 1 2021 1. You are interested in the average home price in Clarksville in 2018. To gather your sample, you breakdown Clarksville into these groups: River area, Rossview, Northeast, Ft. Campbell, and Sango. You randomly choose two of these areas and survey all homes sold in those two areas. What type of sampling is this? A. Convenience B. Stratified C. Cluster D. Systematic 2. A campaign manager is interested in the amount of votes her candidate woul...

And that's how you make extra money

-
STAT 200 Week 7 Homework Problems Solutions (Approach-1), University of Maryland University College (UMUC)
- Exam (elaborations) • 9 pages • 2022
- $17.99
- + learn more
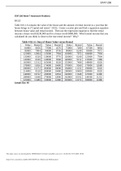
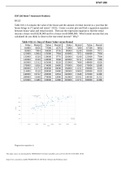
STAT 200 Week 7 Homework Problems 10.1.2 Table #10.1.6 contains the value of the house and the amount of rental income in a year that the house brings in ("Capital and rental," 2013). Create a scatter plot and find a regression equation between house value and rental income. Then use the regression equation to find the rental income a house worth $230,000 and for a house worth $400,000. Which rental income that you calculated do you think is closer to the true rental income? Why? Table ...
-
STAT 200 Week 7 Homework Problems Solutions (Approach-1), University of Maryland University College (UMUC)
- Exam (elaborations) • 8 pages • 2023
- $17.99
- + learn more
STAT 200 Week 7 Homework Problems 10.1.2 Table #10.1.6 contains the value of the house and the amount of rental income in a year that the house brings in ("Capital and rental," 2013). Create a scatter plot and find a regression equation between house value and rental income. Then use the regression equation to find the rental income a house worth $230,000 and for a house worth $400,000. Which rental income that you calculated do you think is closer to the true rental income? Why? Table ...
-
STAT 200 FINAL EXAM 2020 | STAT200 FINAL EXAM_Graded A
- Exam (elaborations) • 26 pages • 2021
- $14.99
- 1x sold
- + learn more
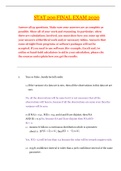
STAT 200 FINAL EXAM 2020 Answer all 25 questions. Make sure your answers are as complete as possible. Show all of your work and reasoning. In particular, when there are calculations involved, you must show how you come up with your answers with critical work and/or necessary tables. Answers that come straight from programs or software packages will not be accepted. If you need to use software (for example, Excel) and /or online or hand-held calculators to aid in your calculation, please cite t...
-
STAT 200 STAT200 MIDTERM EXAM ANSWERS - UMUC (all solutions 100% correct) | UMUC STAT 200 Midterm Exam Answers
- Exam (elaborations) • 13 pages • 2022
- $13.49
- + learn more
STAT 200 STAT200 MIDTERM EXAM ANSWERS - UMUC (all solutions 100% correct) | UMUC STAT 200 Midterm Exam Answers STAT 200 STAT200 MIDTERM EXAM ANSWERS - UMUC (all solutions 100% correct) | UMUC STAT 200 Midterm Exam Answers Stat 200 Midterm Exam Spring 1 1. You are interested in the average home price in Clarksville in 2018. To gather your sample, you breakdown Clarksville into these groups: River area, Rossview, Northeast, Ft. Campbell, and Sango. You randomly ch...
-
STAT 200 FINAL EXAM 1 ; Latest Complete Solutions with shown working, University Of Maryland - University College.
- Exam (elaborations) • 18 pages • 2021
- $17.47
- + learn more
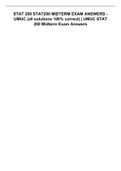
STAT200 FINAL EXAM STAT200 FINAL EXAM 1. True or False. Justify for full credit. (a) If the variance of a data set is zero, then all the observations in this data set are zero. (b) If P(A) = 0.4 , P(B) = 0.5, and A and B are disjoint, then P(A AND B) = 0.9. (c) Assume X follows a continuous distribution which is symmetric about 0. If , then . (d) A 95% confidence interval is wider than a 90% confidence interval of the same parameter. (e) In a right-tailed test, the value of the test statistic is...
